
Your prevention numbers, ready before the board asks.
Inspections, permits, fees, investigations, ITM reports and hydrants, charted from the records your department already keeps. Pick a period, read what changed in plain sentences, and print a board-ready PDF in one click.

A report module in a response RMS counts records. It cannot tell you what changed.
The questions a fire marshal is actually asked, whether the pass rate is slipping, whether plan reviews are slowing, whether a run of fires is a pattern, need the prevention records themselves, compared honestly against the same period a year earlier.
A count is not a comparison
A report module prints this month's number and stops. Whether it is up or down, and against what, is left to the reader.
Every figure sits beside the prior period, and the move is stated the way a board understands it: rates in points, counts and dollars in percent, durations in days.
An export is a spreadsheet somebody has to build
When the report module stops at a CSV, someone assembles the chart by hand every month and nobody trusts it twice.
The chart is the page, the insight sentences are written for you, and the CSV is one button beside them.
Prevention data stored as text cannot be charted
A bolted-on module stores violations, review rounds and fire causes as text boxes, so there is nothing to chart.
Violations, review rounds and causes are fields on the property, the permit and the case, and the analytics read them without anyone re-keying.
Shown with sample data. Click the image to see the whole page.
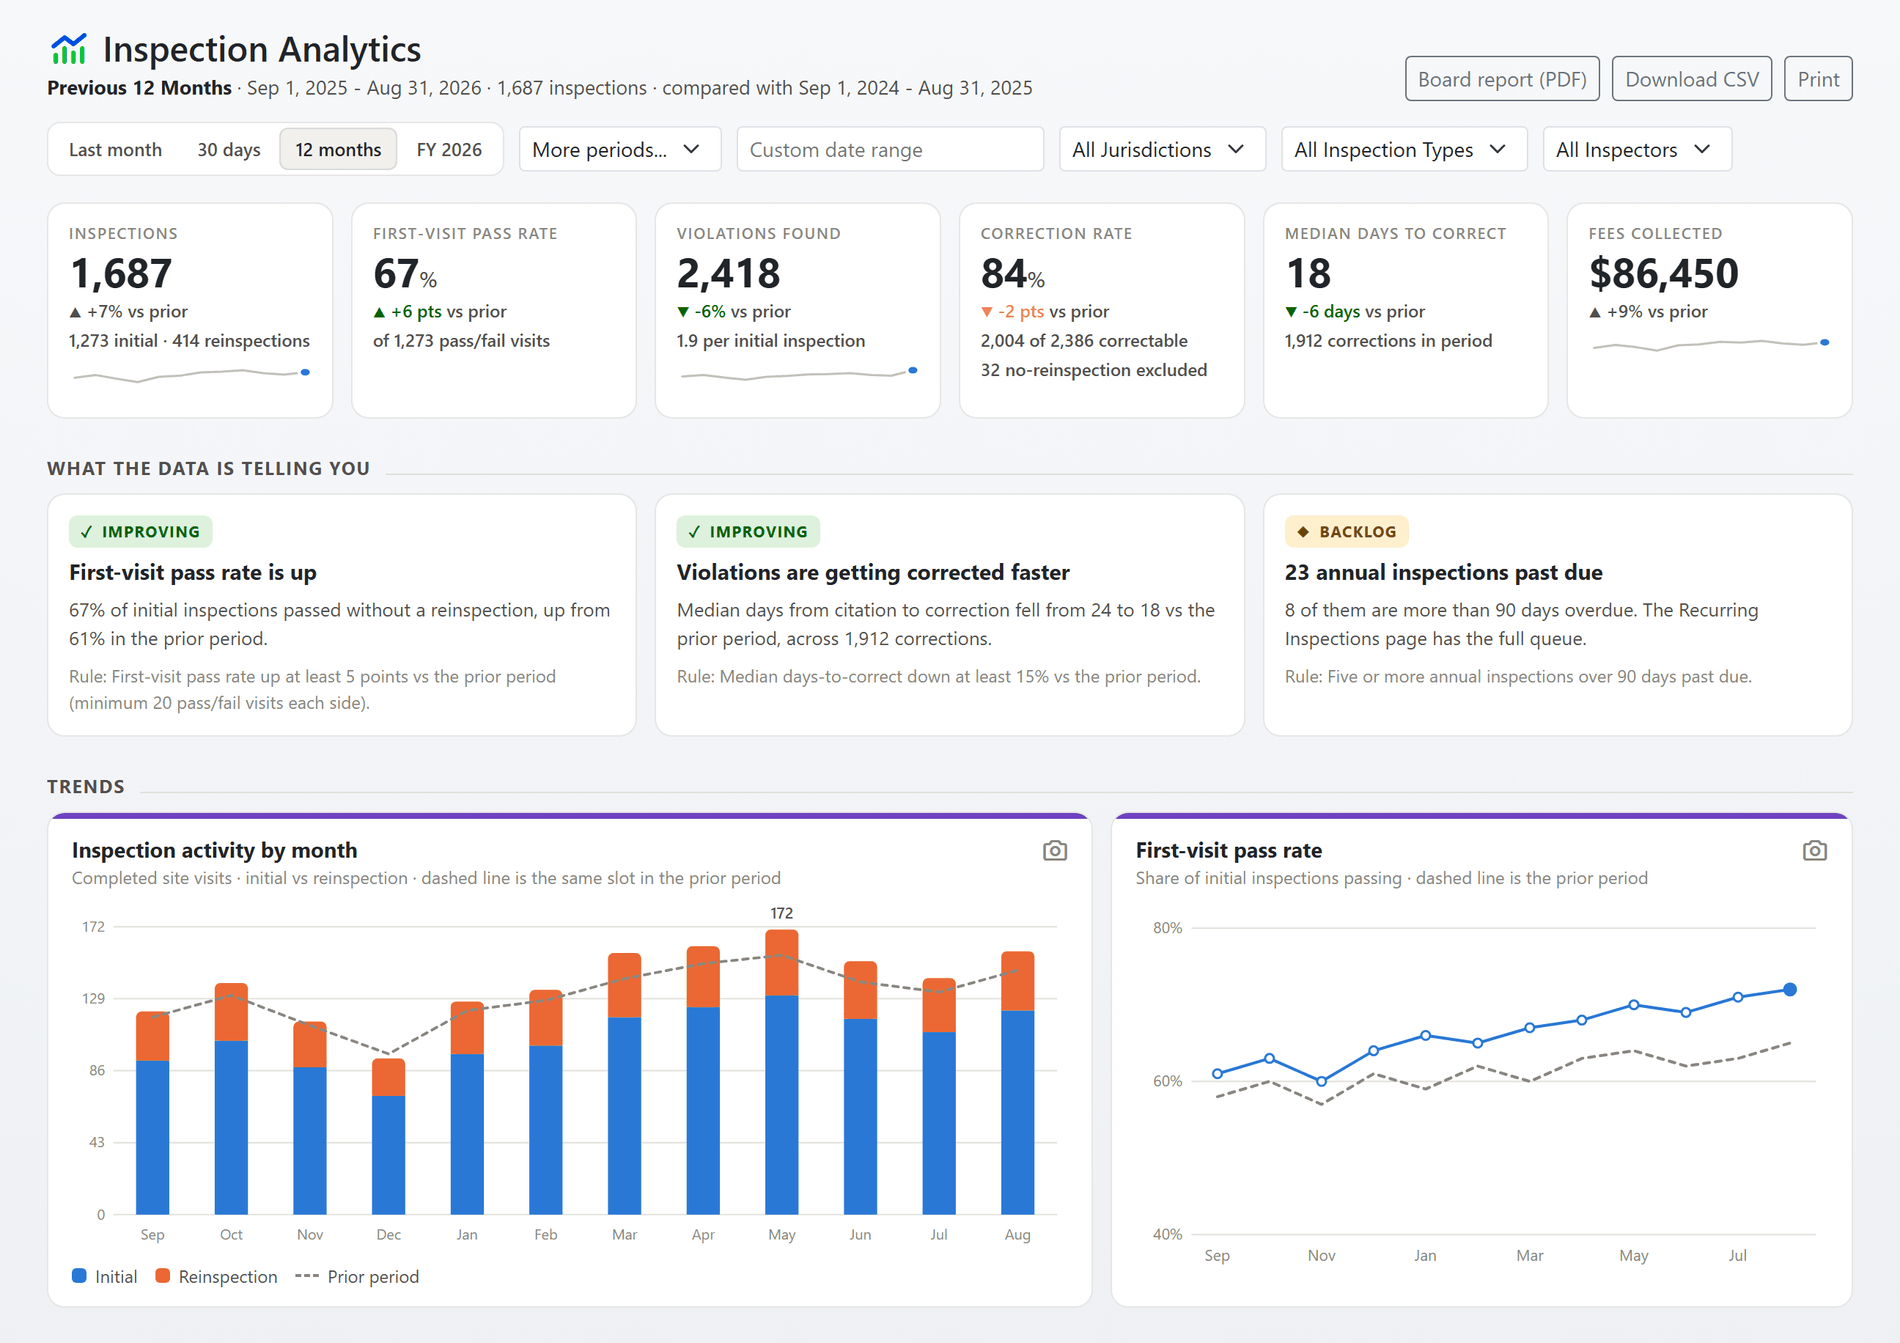
What was inspected, what failed, and how fast it was fixed.
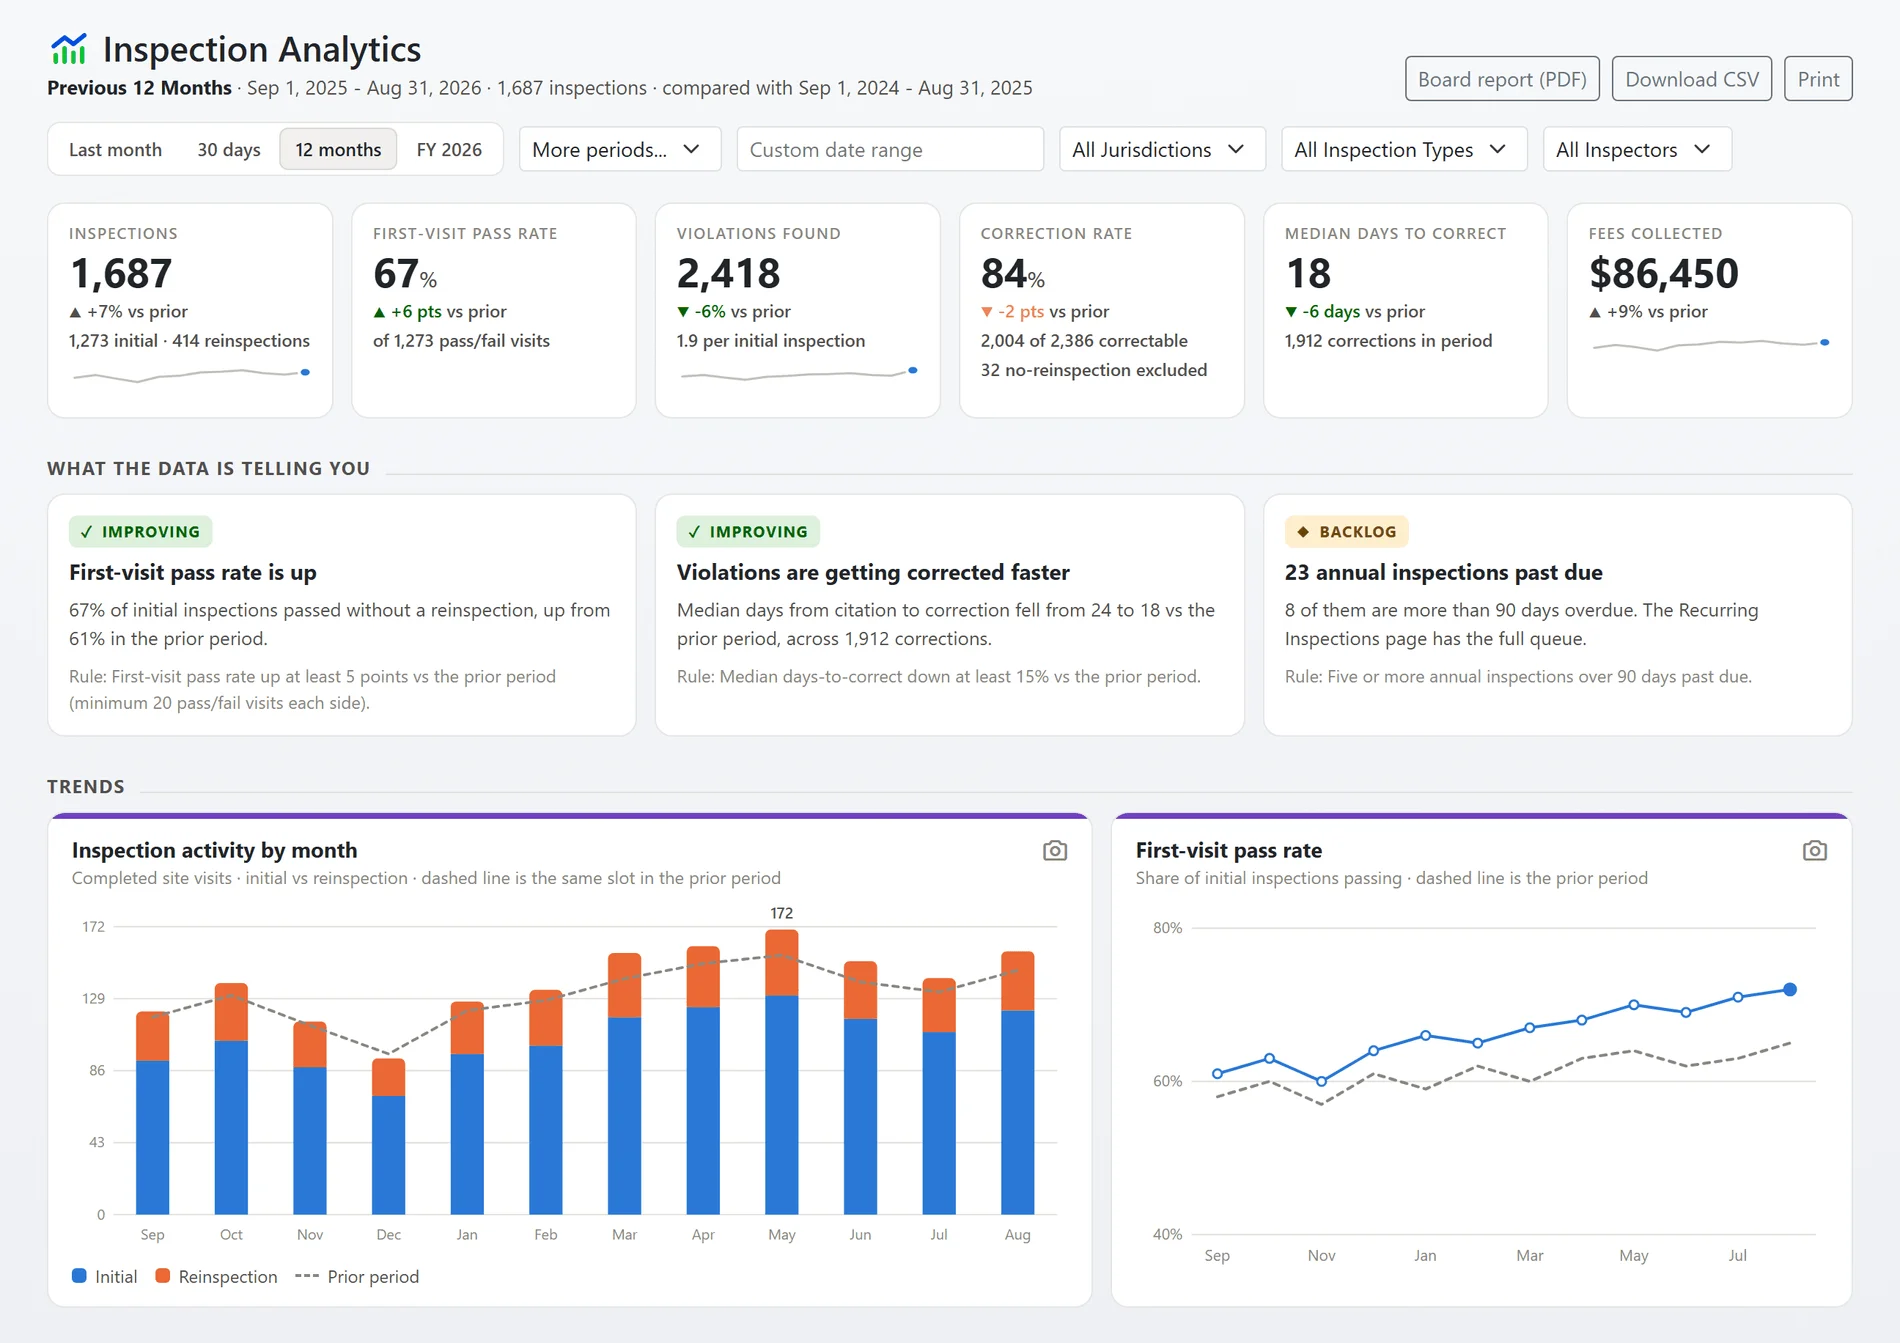
The inspection analytics page turns a year of site visits into six numbers a chief can quote, three sentences that say what changed, and the charts behind them. Every figure is compared with the same window a year earlier.
- First-visit pass rate: the share of initial inspections that passed without a reinspection, month by month against the prior period.
- Violations found and corrected: citations written each month beside the corrections completed that month, so the stretch where a backlog builds is visible on one chart.
- Days to correct: the median from citation to correction, with a rule that flags the period when corrections slow down or speed up.
- Hours and fees: hours logged on completed visits, assisting inspectors included, and inspection fees marked paid each month.
- Filters that match how you work: a month, thirty days, twelve months, a fiscal year or a custom range, narrowed to one jurisdiction, one inspection type or one inspector.
Shown with sample data.
Shown with sample data. Click the image to see the whole page.
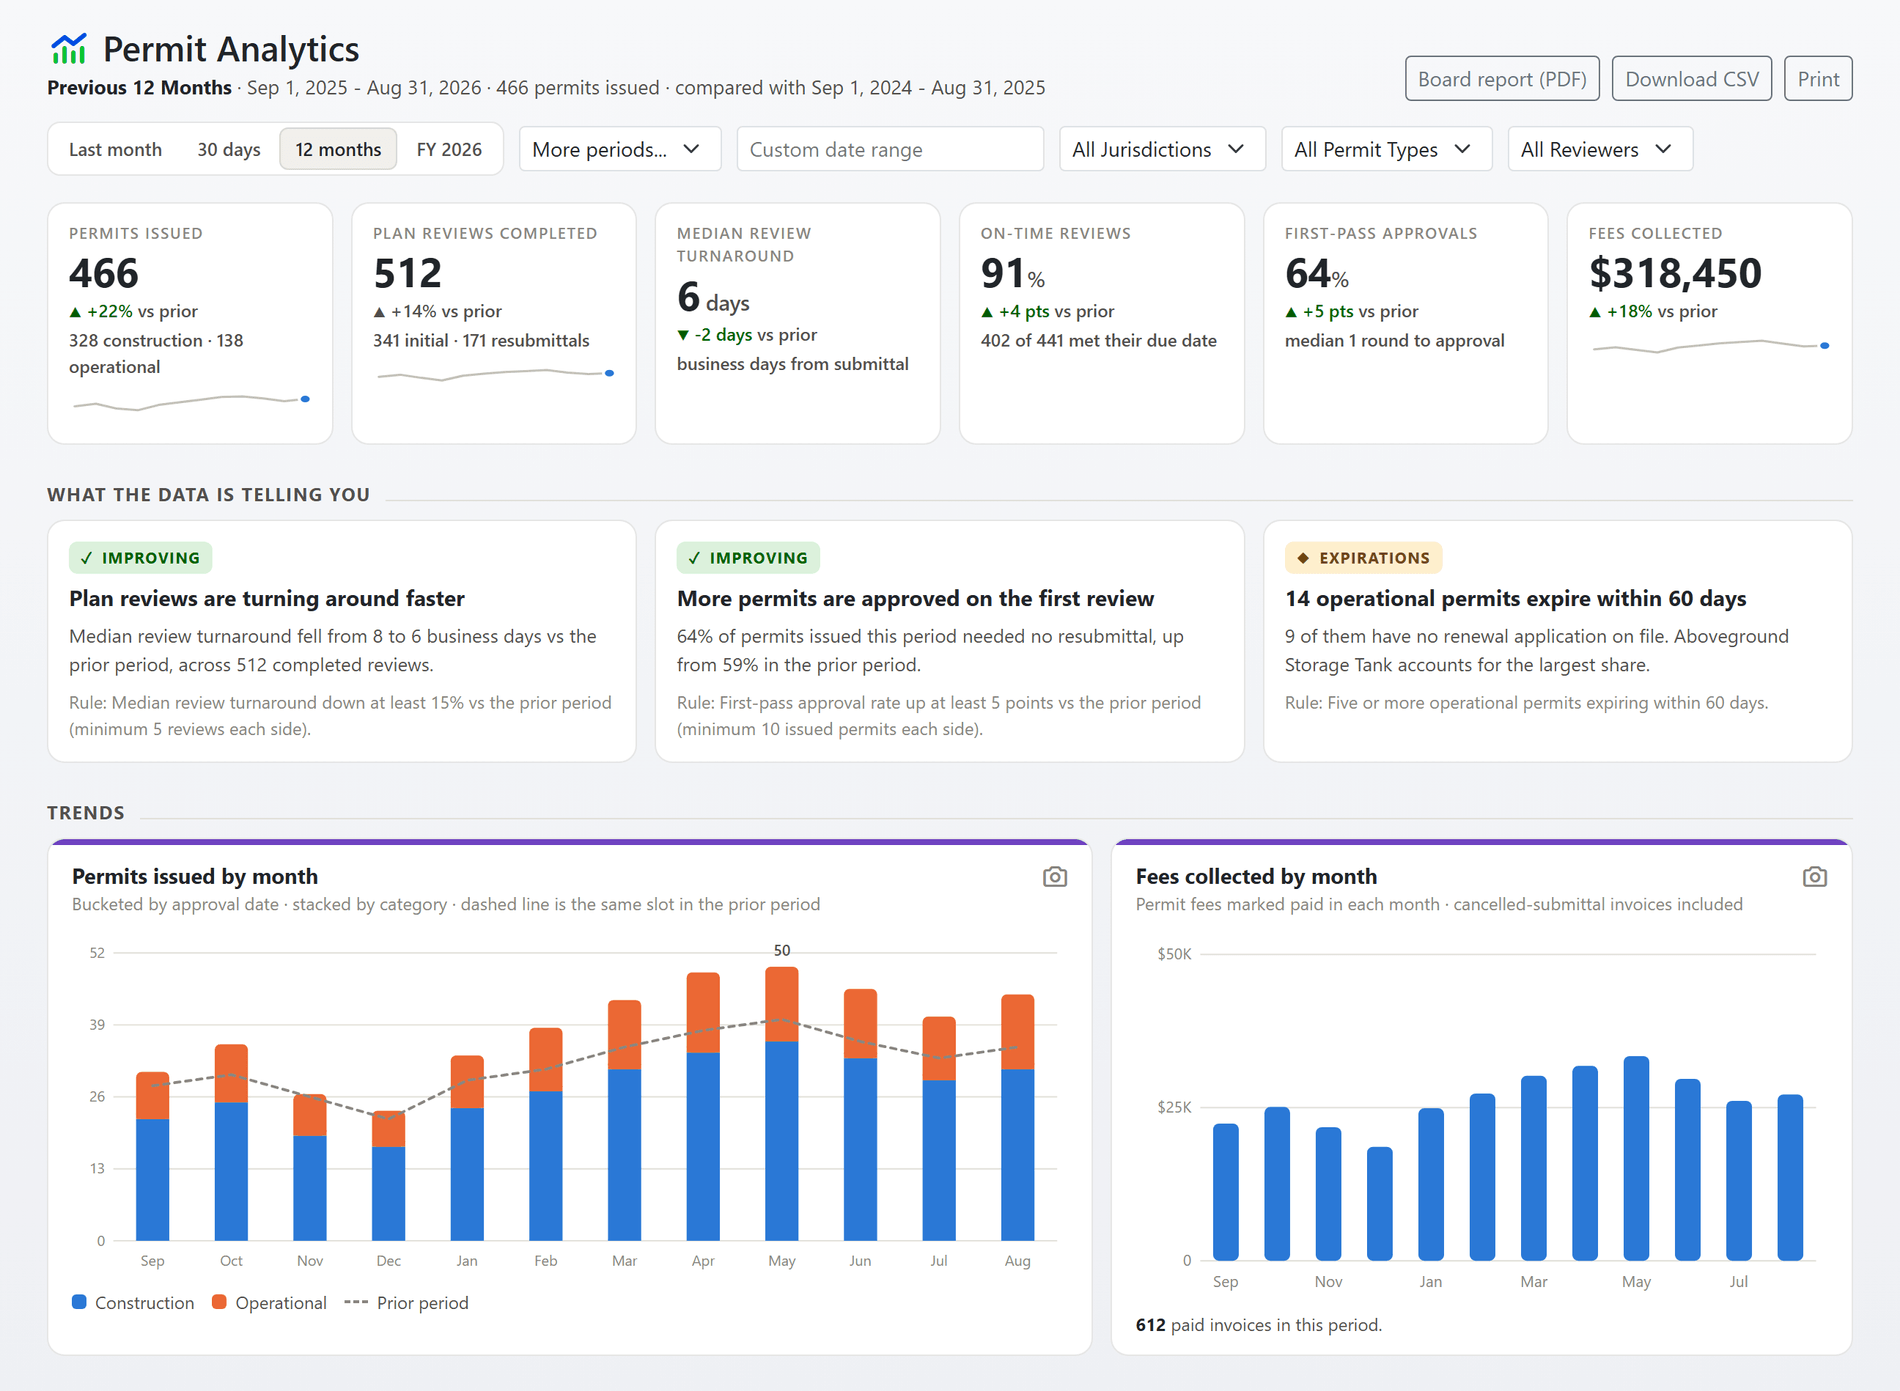
Volume, turnaround and revenue on one page.
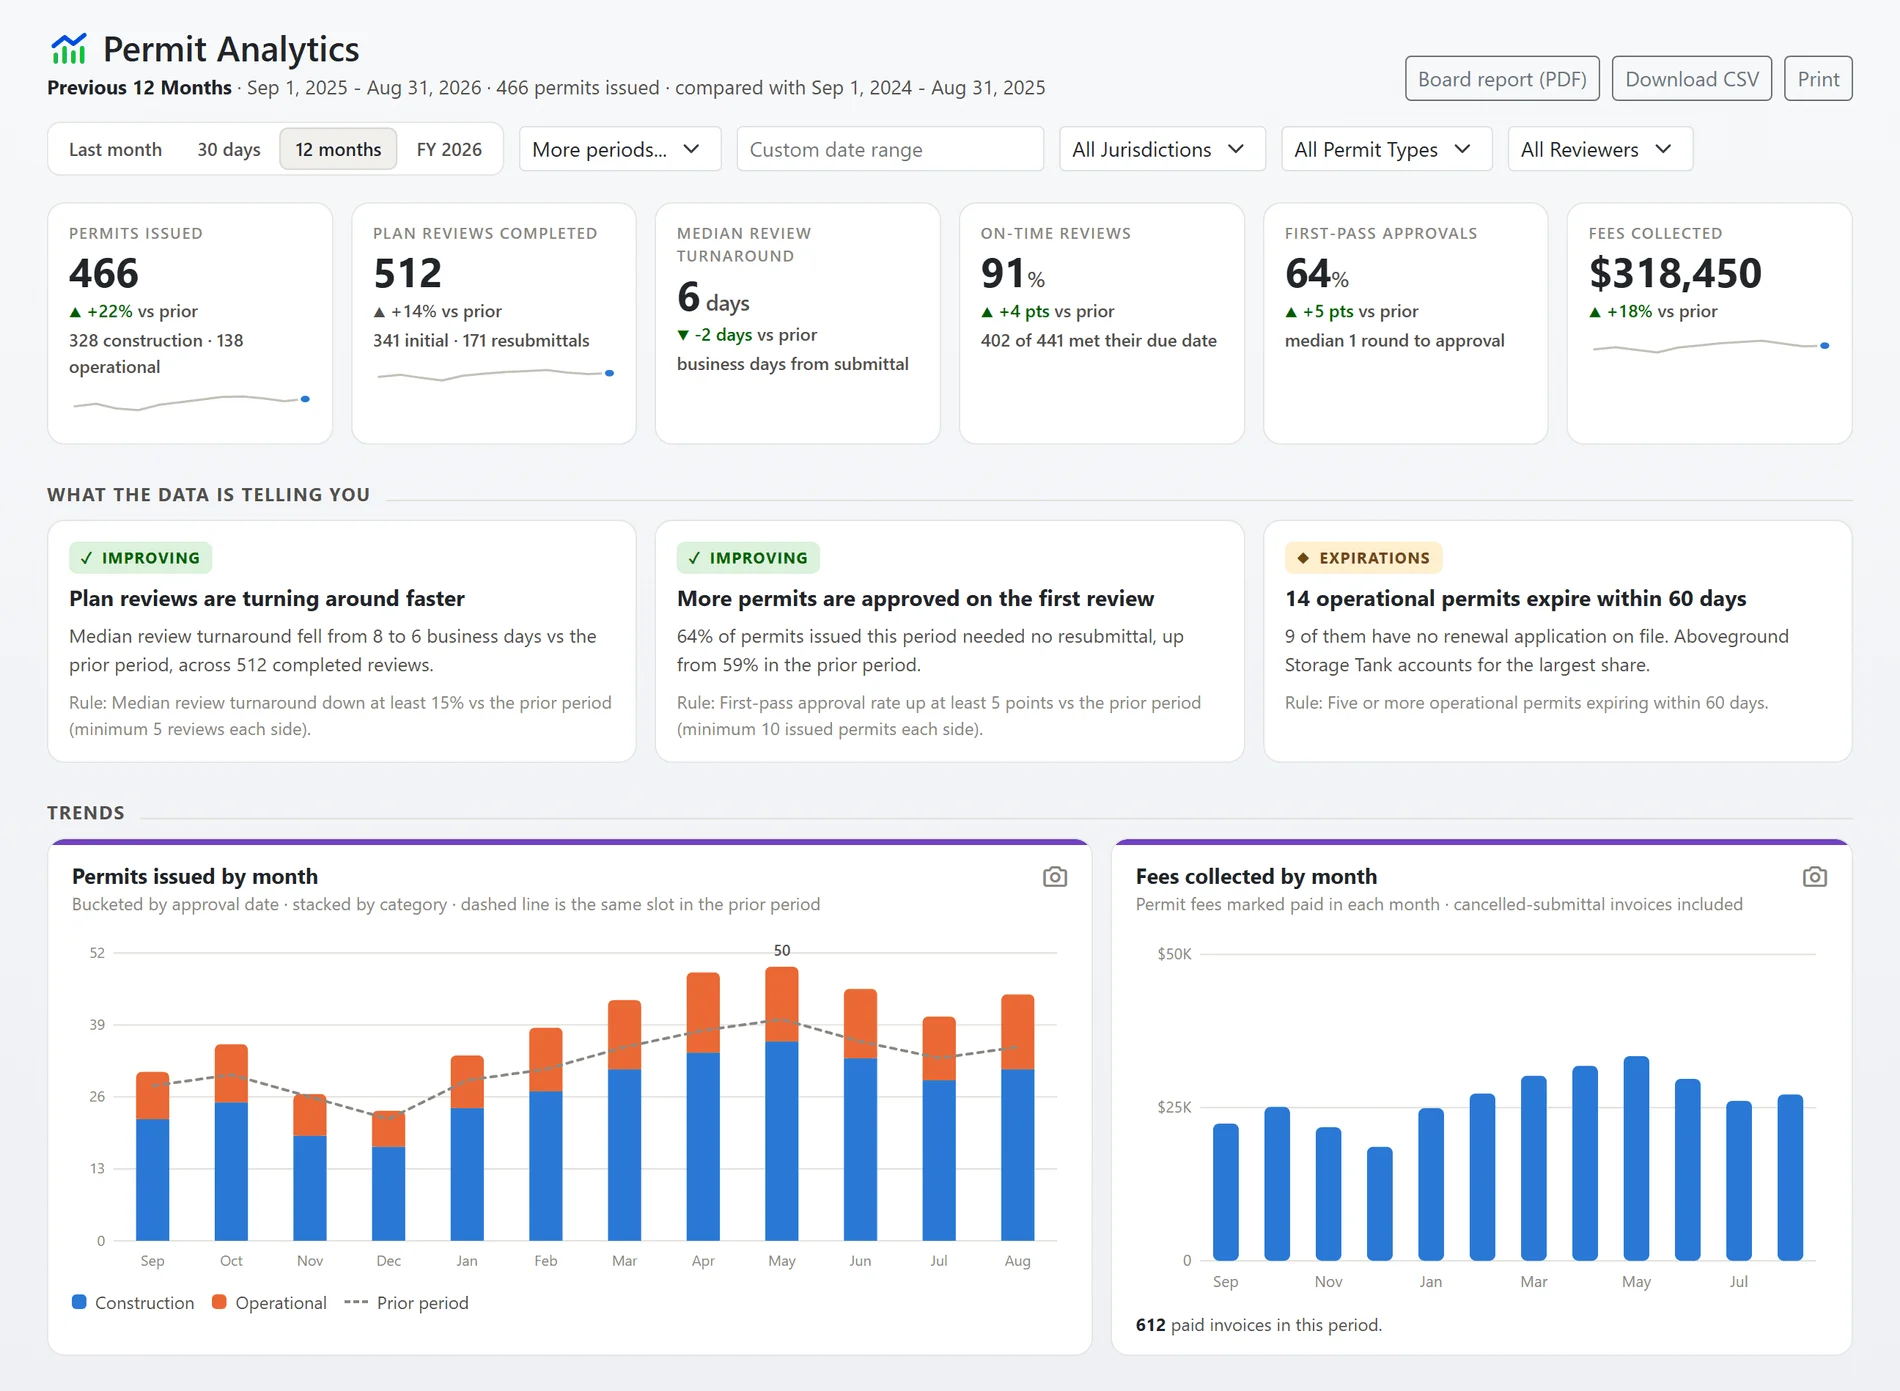
Permit analytics reads the permits your desk issued and the plan reviews behind them: how many, how fast, how often on the first try, and what they brought in.
- Permits issued: by month, construction against operational, with the same month a year earlier drawn as a dashed line, and the top permit types with their change.
- Review turnaround: the median business days from submittal to decision, and the share of reviews finished by their due date.
- First-pass approvals: how many permits needed no resubmittal, and the median number of review rounds to approval.
- Fees collected: permit fees marked paid each month, with the number of invoices behind the figure.
- The queue and the calendar: open submittals by status right now, applications stalled on the applicant's side, and operational permits expiring in the next ninety days or lapsed without a renewal on file.
Shown with sample data.

Shown with sample data. Restricted to staff with the Investigation View permission. Click the image to see the whole page.
Cause, loss and clearance, with the pattern alert built in.
Investigation analytics reads every case's cause classification, loss estimate, dates and location, and watches for the thing a chief most wants to hear about early: incendiary fires running above the department's own history.
- Pattern alert: incendiary cases in the last sixty days are measured against your two-year rate; when they run high, the alert names the cases, how many sit within a two-mile radius of one another and how many ignited overnight.
- Cause and loss trends: the cause mix by fiscal year, estimated loss by month, and the single fire that drove the period's loss when one did.
- Clearance and prosecution: incendiary cases closed with an arrest or an exceptional clearance, and each referral followed from prosecutor to charge to conviction.
- The case pipeline: where every open case stands, aged in thirty-day bands, with the oldest named.
- Investigator workload: cases, open cases, median age and determination rate for each primary investigator.
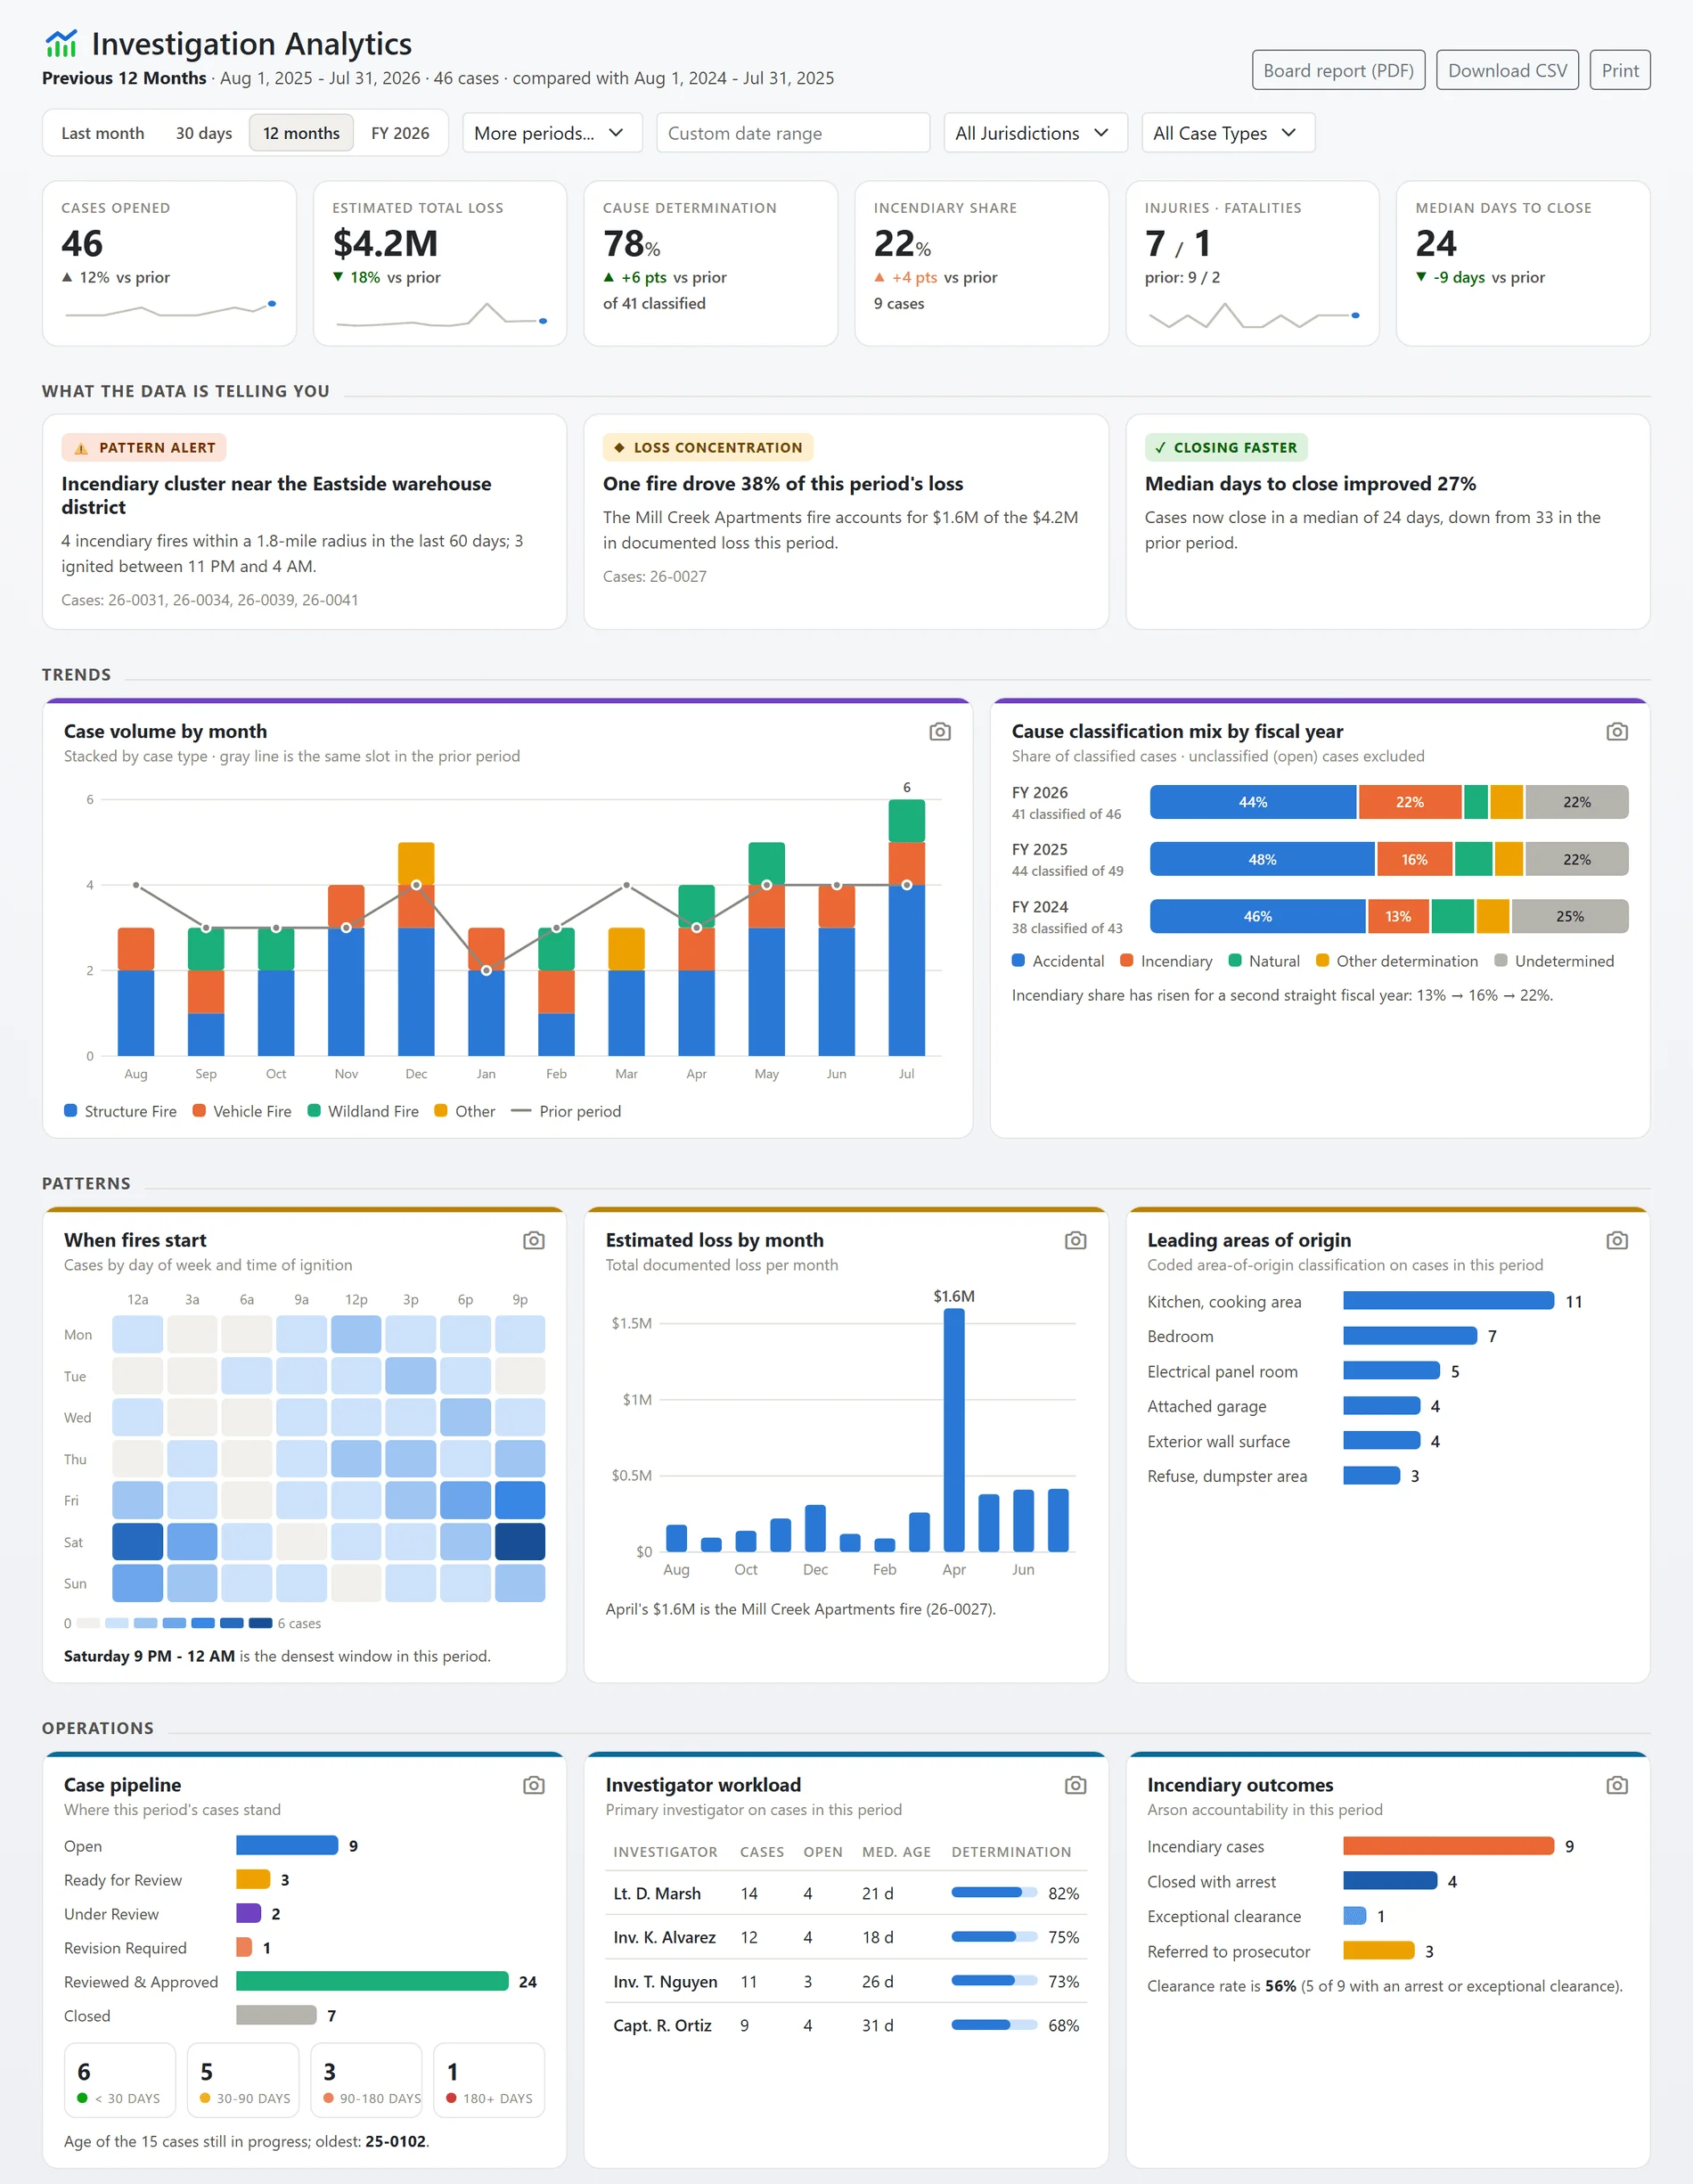
Shown with sample data.
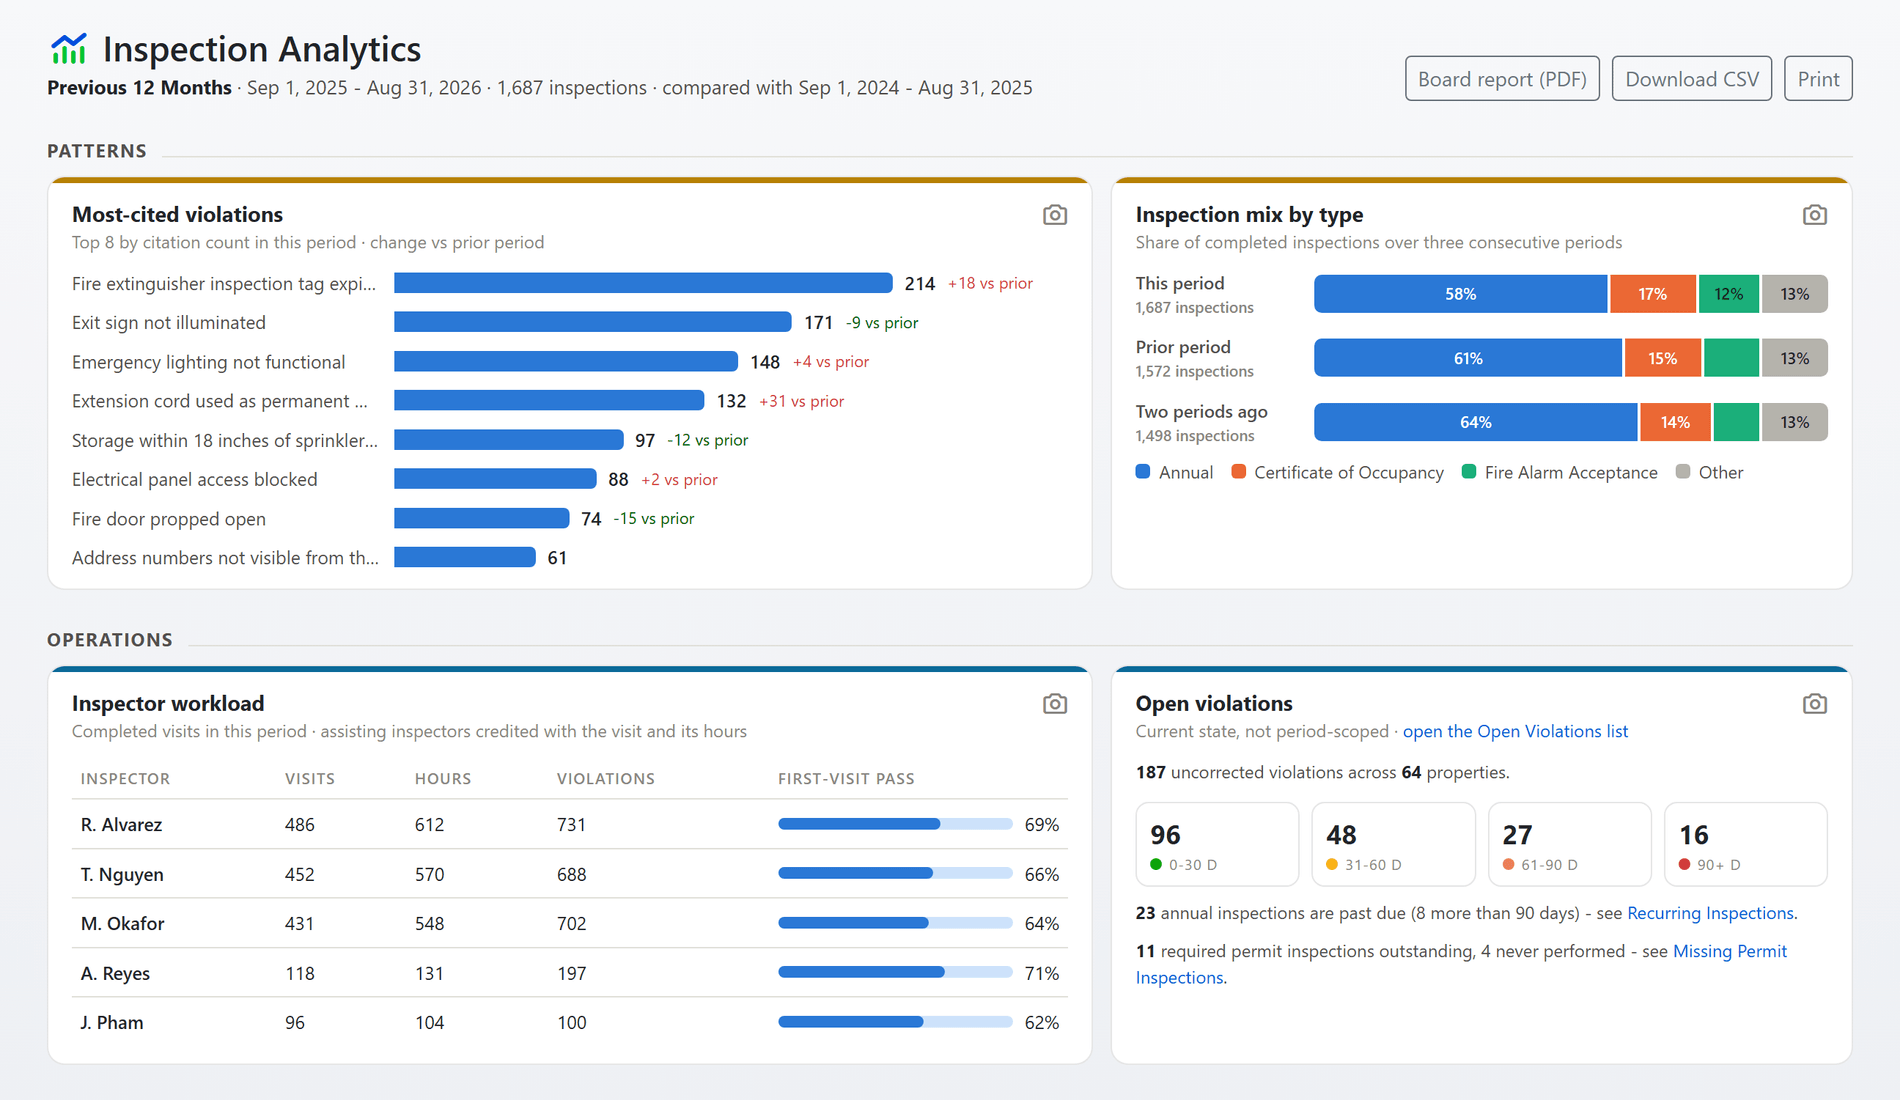
Shown with sample data. Click the image to see the whole page.
Who is doing the work, and where the backlog sits.
Below the trends, every analytics page turns to the questions a supervisor asks on a Monday morning: which violations keep coming up, how the work is spread across the team, and which open items are getting old.
- Most-cited violations: the top citations in the period with their change against the prior period, so a violation that is climbing is flagged before it becomes a habit.
- Inspector workload: visits, hours, violations and first-visit pass rate for each inspector, with assisting inspectors credited for the visit and its hours.
- Open violations aged: uncorrected violations in thirty-day bands, and a map where each pin is sized by the violations open at the property and coloured by the oldest one.
- Past due and outstanding: annual inspections past their due date and required permit inspections never performed, each linked to its queue.
- When the work happens: completed visits by weekday and hour, with the busiest window, the quietest weekday and the share finished before noon.
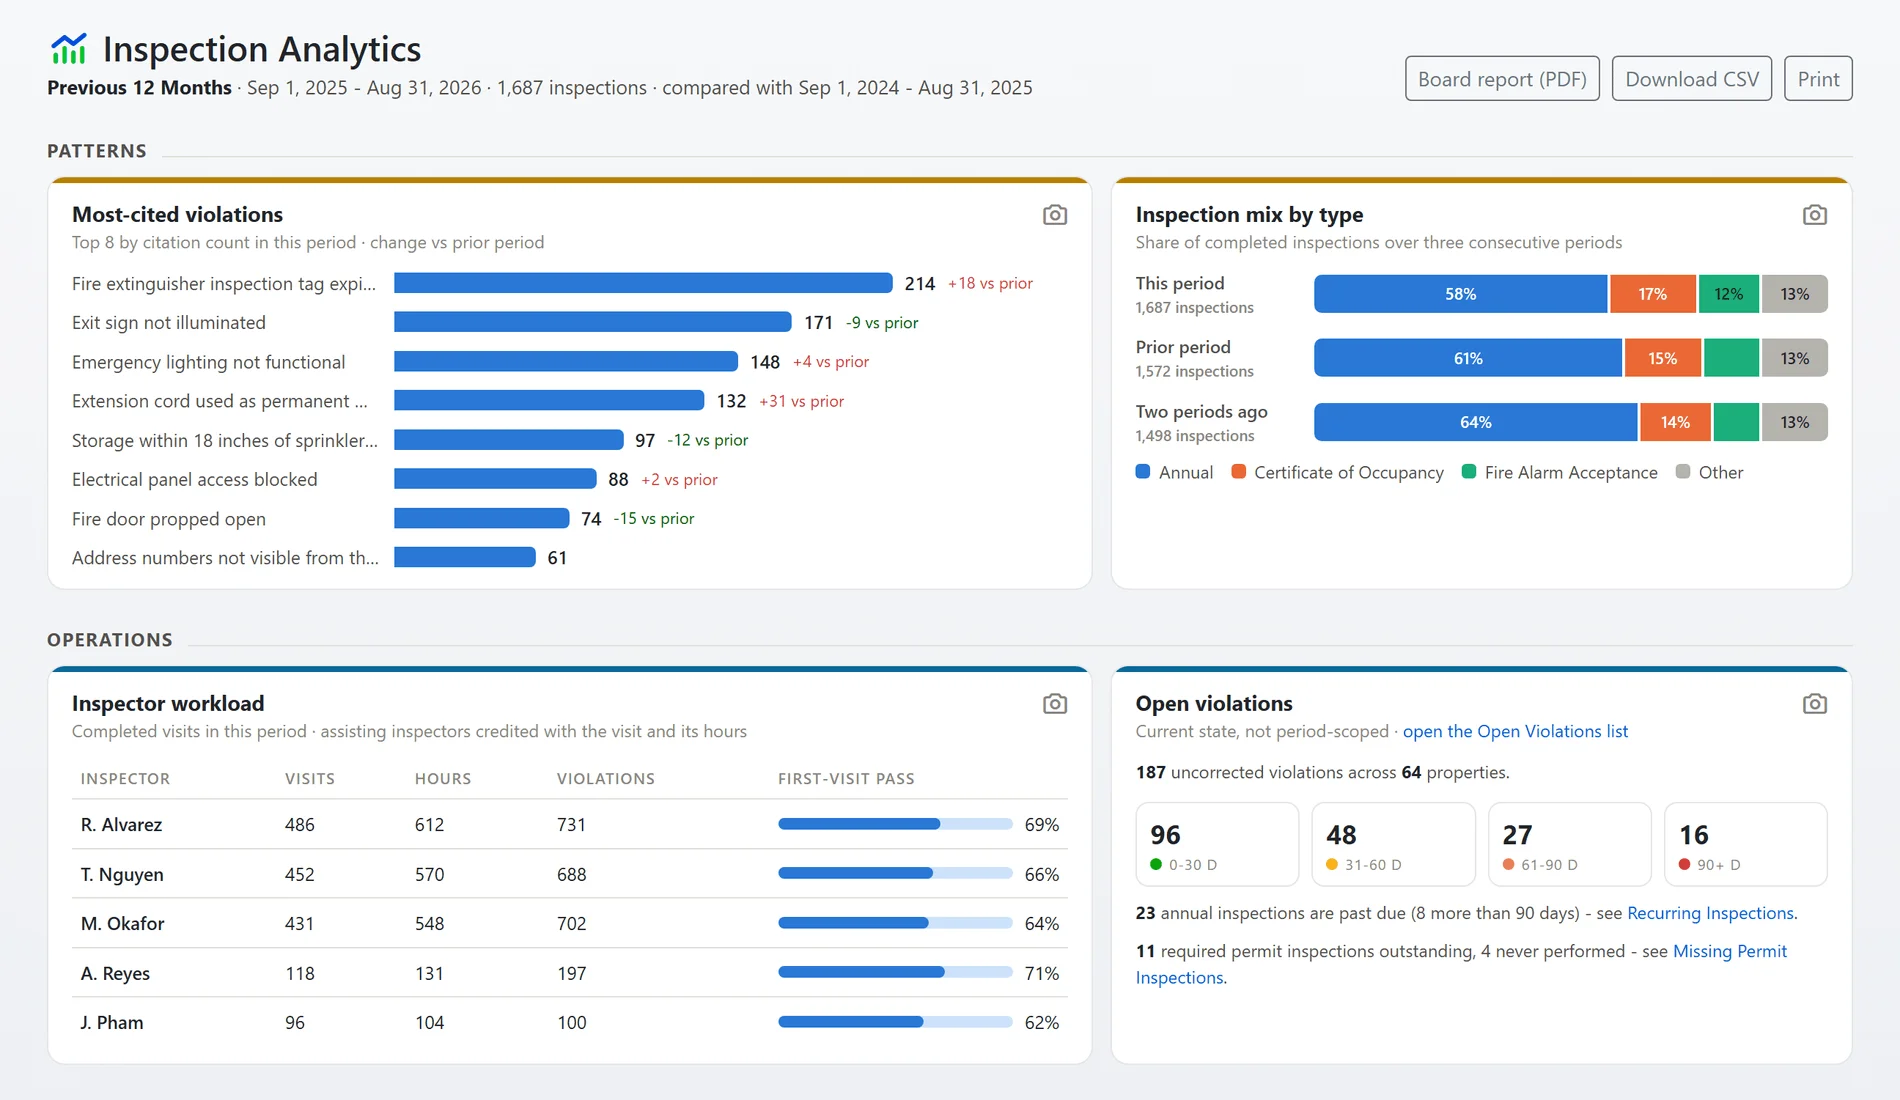
Shown with sample data.
And that is only the start
A board report in one click
The inspection, permit, investigation, ITM report, incident, public education, preplan, records request and user pages each print a board-ready PDF, download their figures as a CSV and save any single card as an image for a slide. Every page prints.
Insights written as sentences
Each page reads its own numbers and writes what changed as a sentence, with the rule that triggered it printed underneath, so nothing is flagged without saying why.
The numbers come to you
Every staff homepage opens with the last thirty days from the module it is about, plus a number from another module, each linking to the page behind it.
ITM reports
Reports filed, systems compliant and open findings, with the contractors who file them and how their findings rates compare.
Hydrants and fire watches
Hydrants inside their inspection cycle, outstanding and out of service; fire watches running right now, rounds logged on time and watches with an overdue round.
Every other module too
Financial collections and aged receivables, public education events and people reached, preplans, properties, records requests, incidents, code enforcement cases and open burning each have an analytics page of their own.
See analytics over your own records.
A one-hour walkthrough with a fire prevention expert, or the demo site right now.