
Every hydrant inspected, tested and accounted for.
Every hydrant on a map with its inspection cycle, flow tests worked out by the standard's own arithmetic, and the water each building needs compared with what the hydrants around it can deliver.

A hydrant layer in a response RMS is a dot on a map.
The RMS knows where the hydrant is because dispatch needs it. Whether anyone has been to it this year, what it flowed last spring, and whether the building beside it has enough water are questions it was never built to answer.
The inspection cycle lives in a spreadsheet
Which hydrants are overdue, which have never been visited, and which engine has them this quarter are three columns somebody keeps by hand, and they drift from the map within a month.
The cycle is measured from each hydrant's last recorded inspection, outstanding is one number on the list, and the assignments are on the map.
A flow test is a PDF in a folder
The pitot arithmetic is done on paper, the projection to 20 psi by whoever remembers the exponent, and the class the hydrant earned never reaches the map the crews look at.
Enter the pressures and the hydraulics are done for you, the class follows NFPA 291, and the map paints every hydrant in its colour.
Nobody compares needed with available
The required fire flow in IFC Appendix B is a calculation almost no department runs building by building, so a chief cannot tell the water utility where the supply falls short.
Every building's required flow is worked out from its record and compared with what the hydrants around it delivered on their last tests.
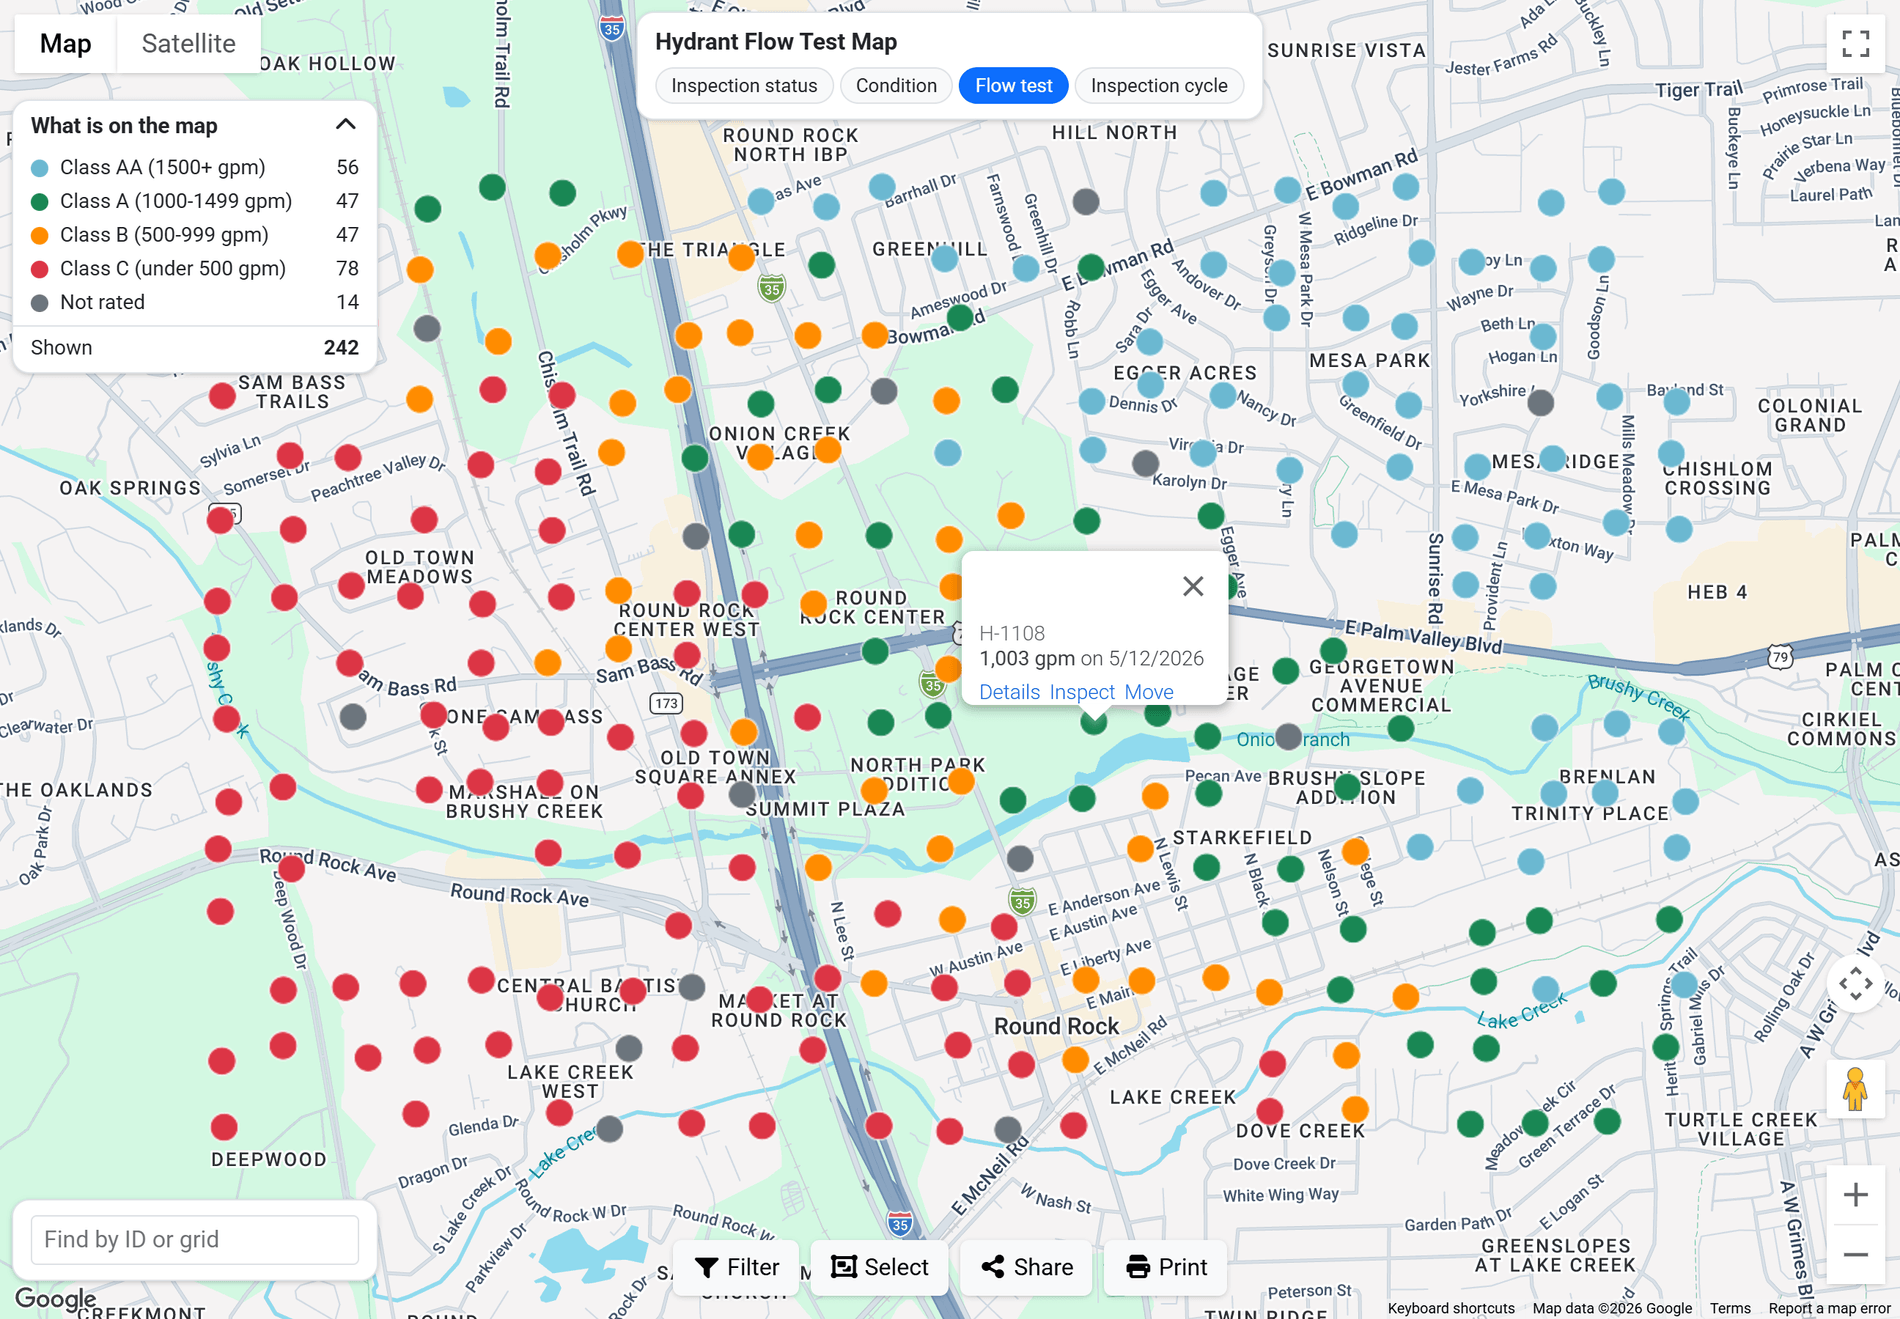
Shown with sample data over Google's map of a real town; every hydrant is fictitious. Click the image to see the whole map.
Every hydrant in its NFPA 291 colour.
One map, four ways of colouring the same hydrants. On the Flow test layer every dot is painted the bonnet colour NFPA 291 prescribes for its class, read from the last flow test's projection to 20 psi, so a chief sees where the water is weak without opening a record. The other three layers colour the same dots by inspection status, by condition and by where each hydrant stands in the inspection cycle.
- The legend is the count and the filter: the What is on the map panel counts each class from the same fetch that drew the dots, and clicking a row keeps only that class on the map.
- A dot opens the hydrant: its flow at 20 psi and the test date, with Details, Inspect and Move beside them.
- Work from the map: select a set of hydrants and assign them to a unit and shift in one go, record an inspection on the spot, add a hydrant where you stand, and share the view as a link that opens on the same place, layer and filters.
- Zoomed out, a heat grid: a department with thousands of hydrants sees density instead of an unreadable blur, and the dots return as it zooms in.
- Your boundary, your zoom: the map opens on the department's own district outline at the zoom it chose.
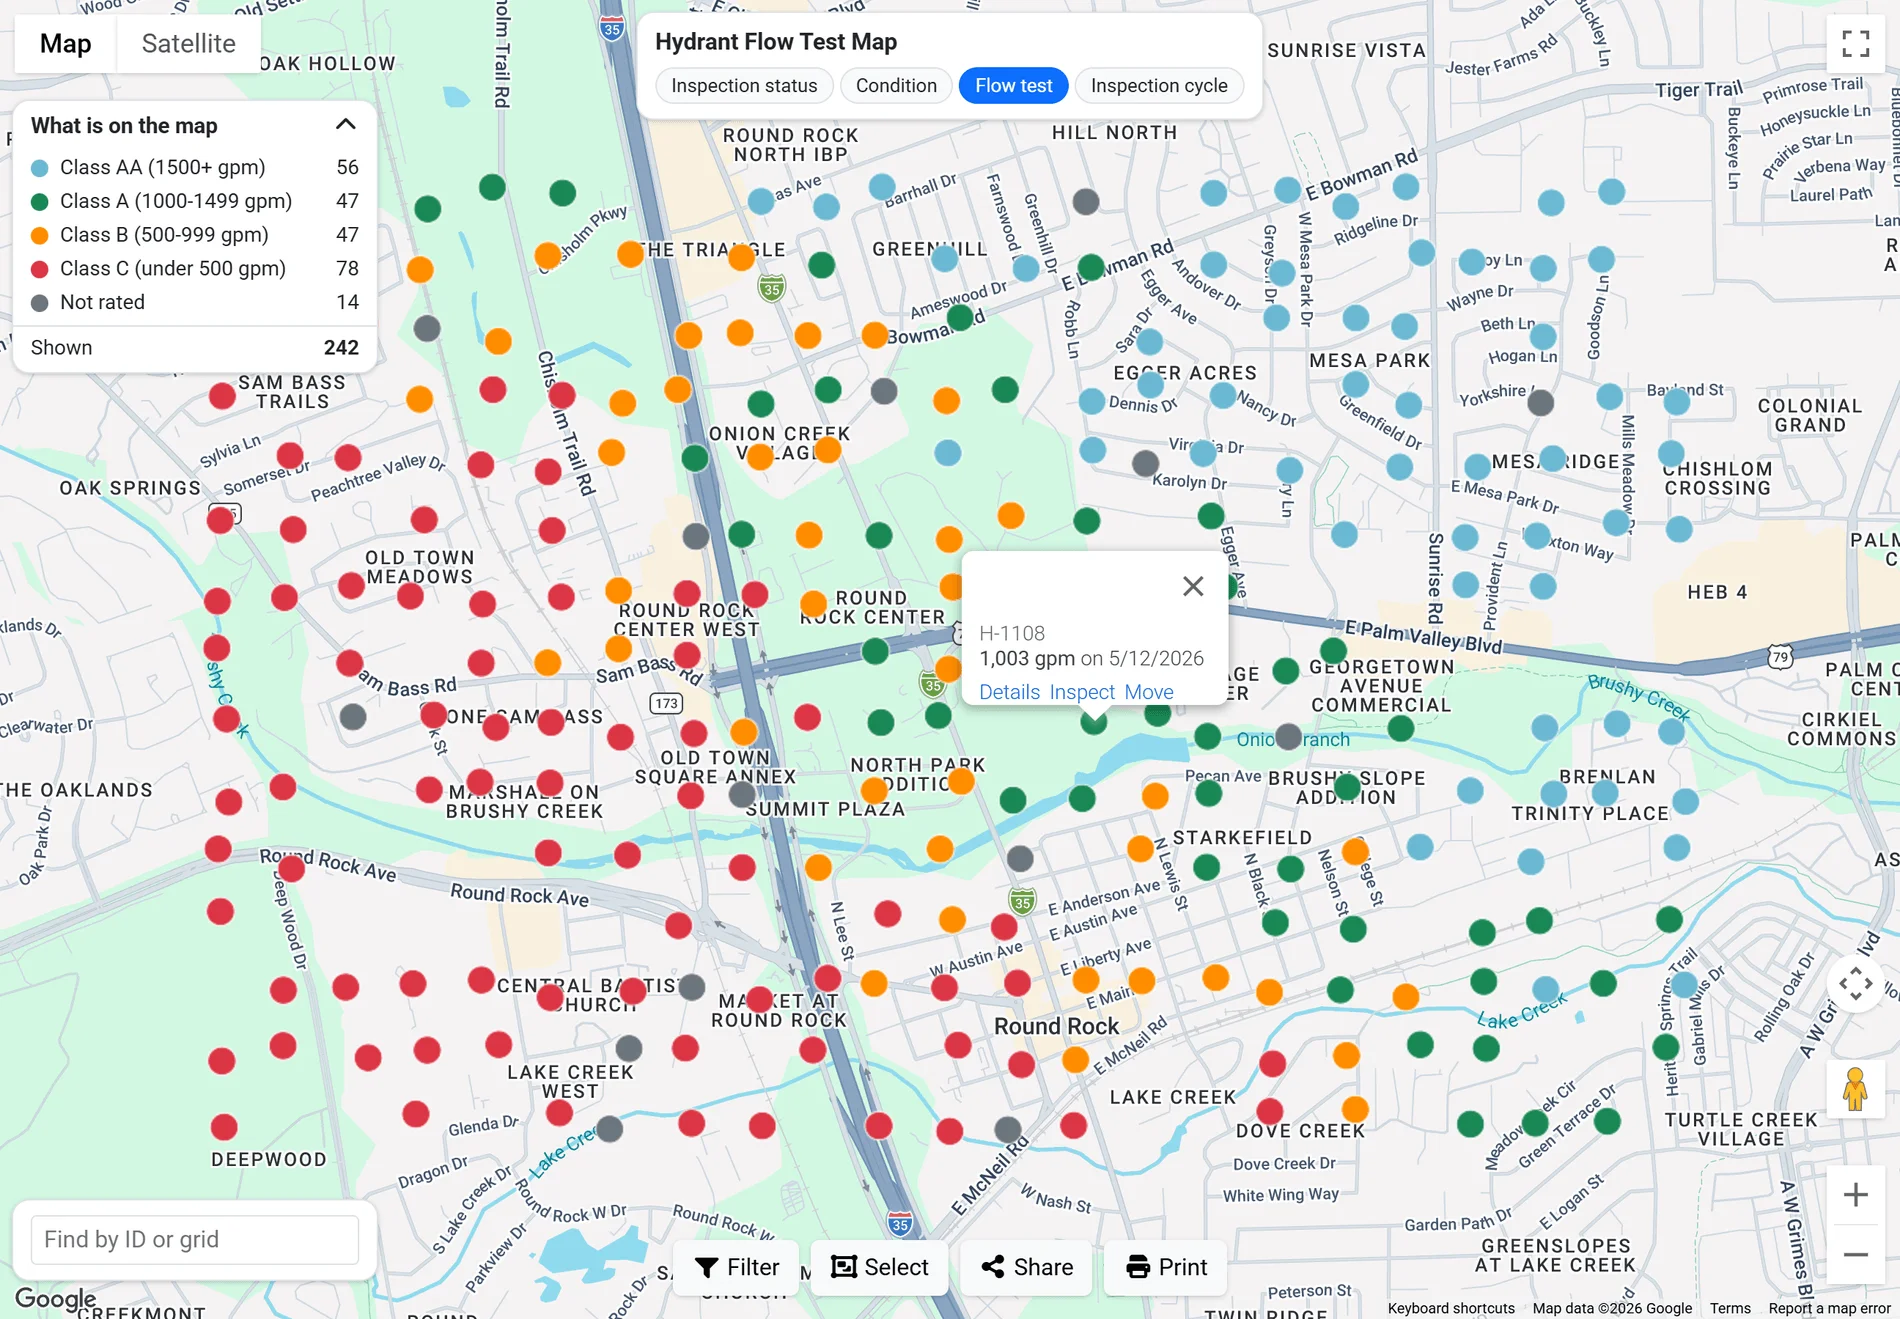
The hydrant flow test map with sample data over Google's map of a real town; every hydrant is fictitious.
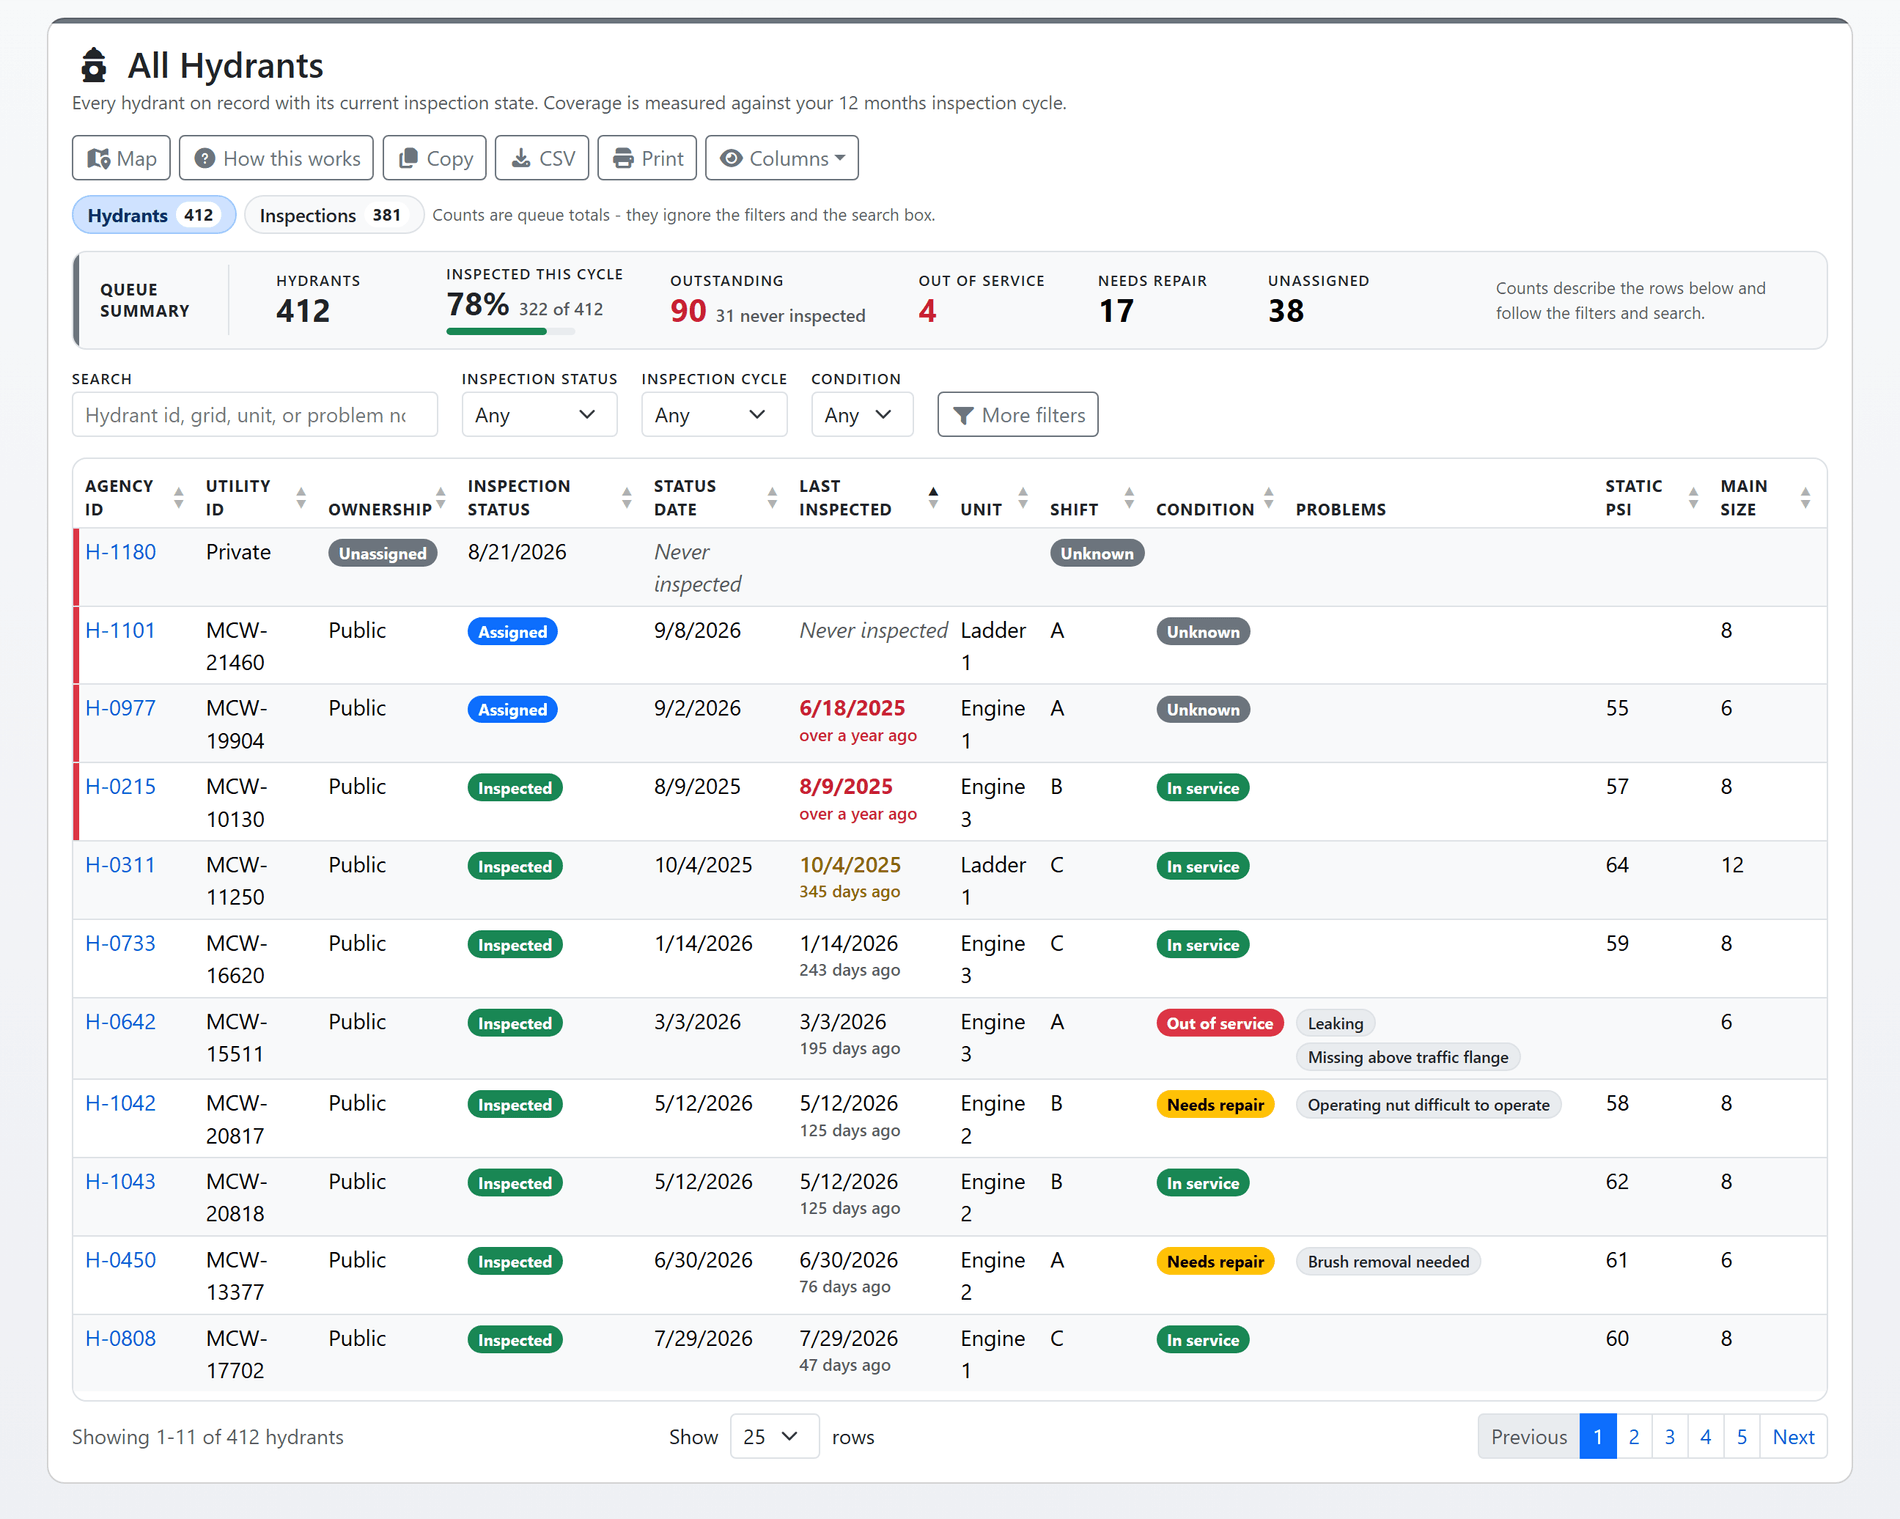
Shown with sample data. Click the image to see the whole page.
Outstanding is one number, and it is on the list.
Every hydrant is expected back on a cycle, twelve months by default or whatever your department sets, and the cycle is measured from the date of the last recorded inspection, never from a status somebody changed this morning. The list answers the question a chief asks first: how many hydrants still need a visit, and which ones.
- One outstanding number: overdue and never inspected are counted together, because both need the same visit, with the never-inspected share noted underneath. Clicking the tile filters the table to them.
- Coverage against your own cycle: the share of hydrants inspected this cycle, out-of-service and needs-repair counts, and the unassigned count, all read from the same query as the rows so the panel and the table cannot disagree.
- Two queues over one record: one row per hydrant with its current state, or one row per recorded inspection, newest first, so a month of work reads back as a list.
- Search, filter, export: by hydrant id, grid, unit or problem note; by status, cycle, condition, problem, ownership, unit, shift and jurisdiction; copied, downloaded as CSV or printed, with the columns you choose.
- Assigned by unit and shift: a hydrant is given to an engine and a shift one at a time from its record, or a whole map selection at once, and every inspection is stamped with who made it.
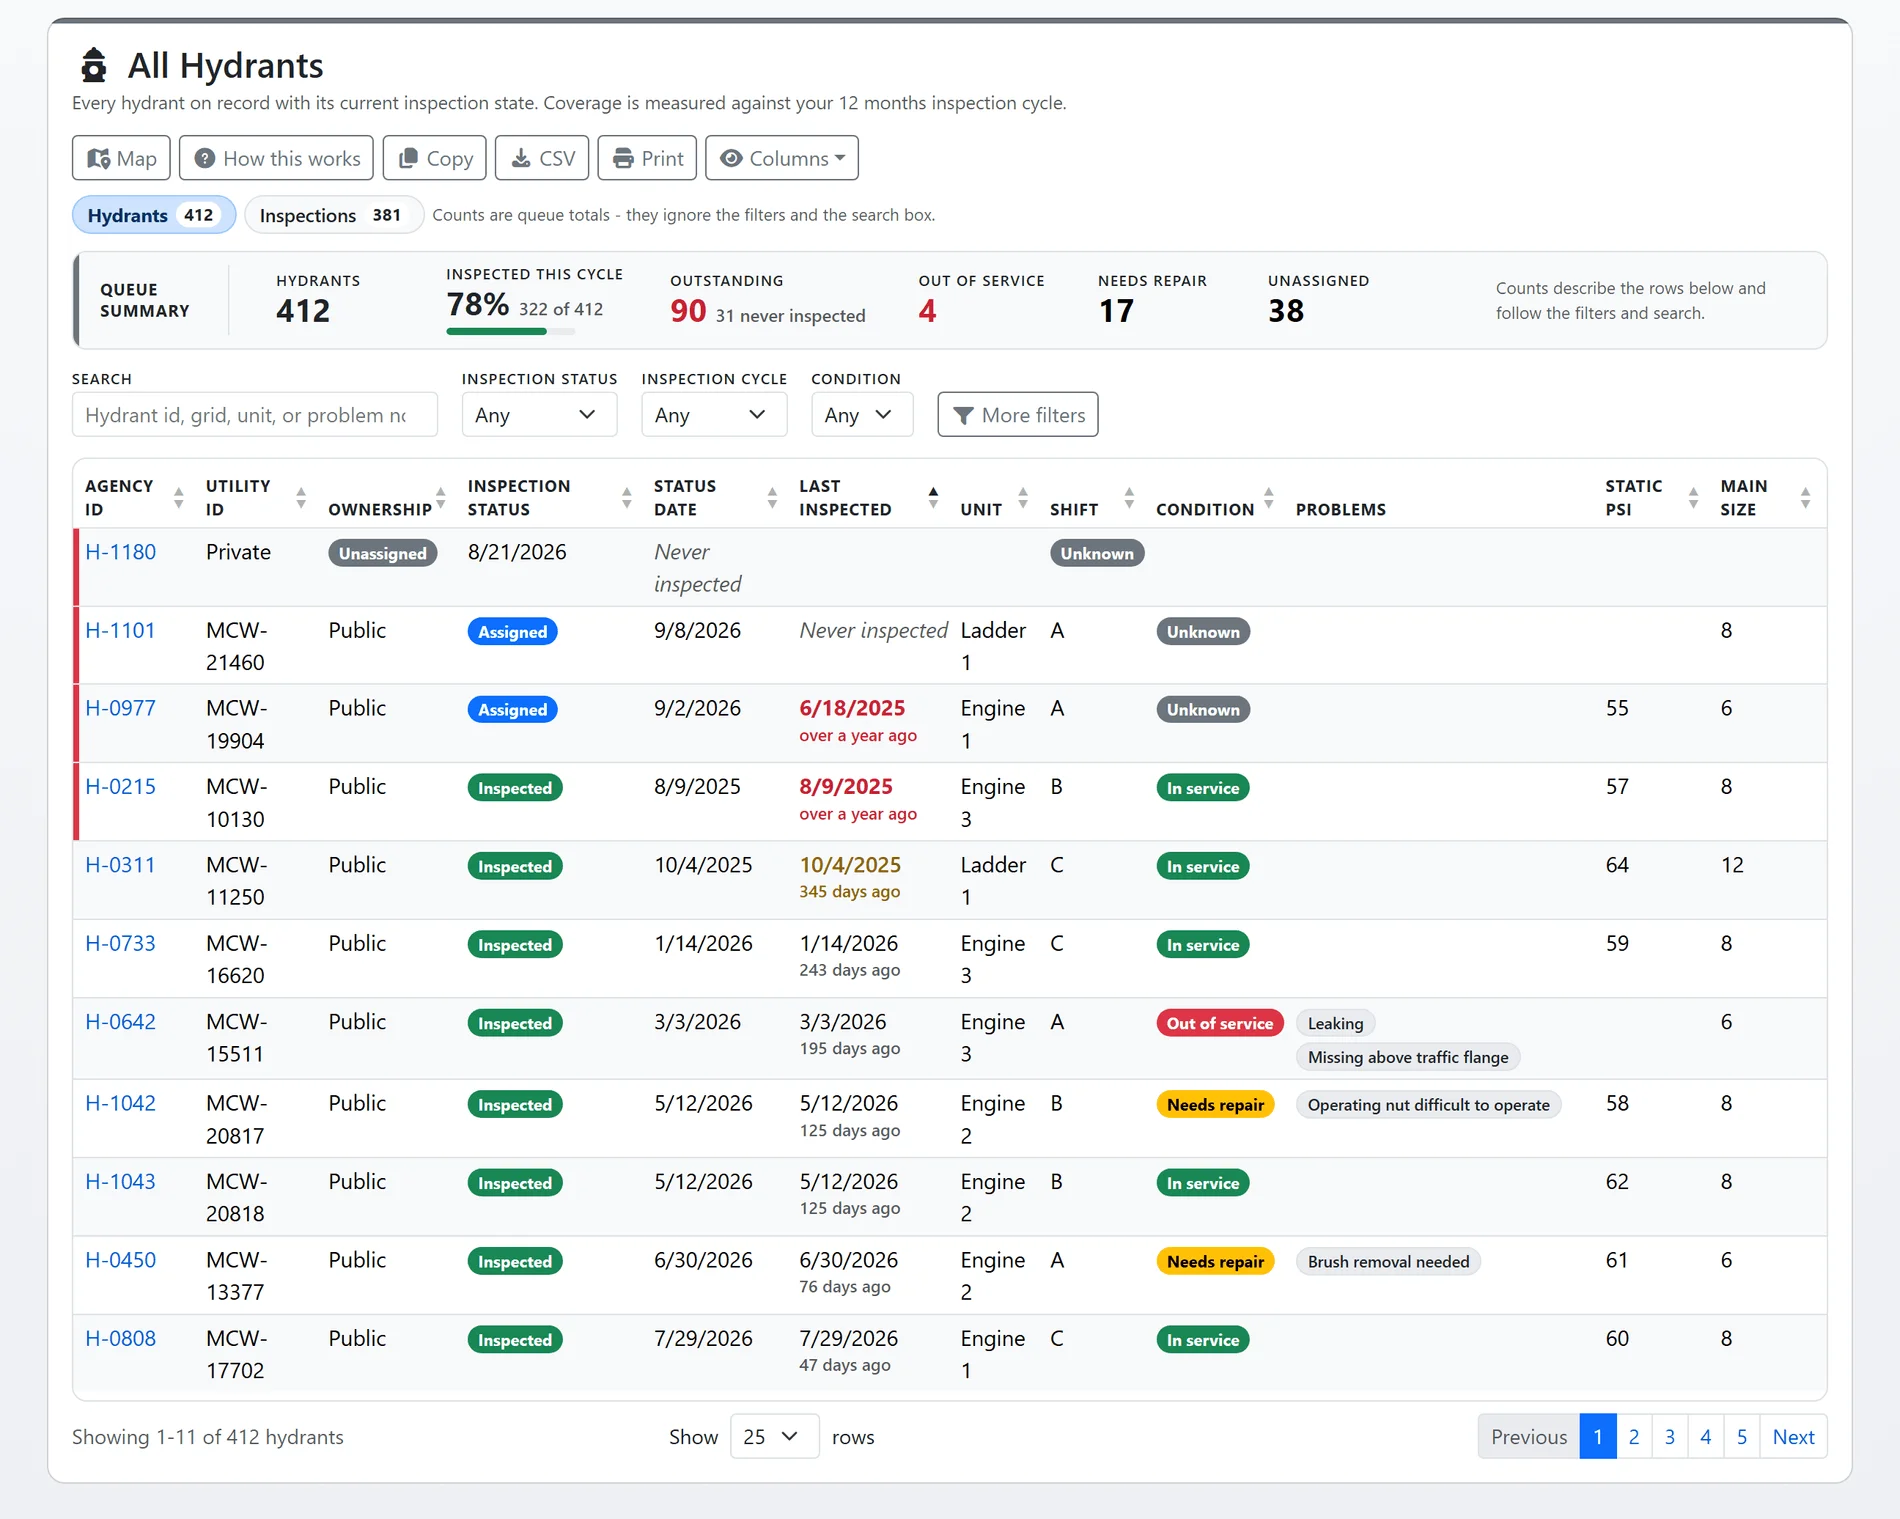
Shown with sample data.
Shown with sample data. Click the image to see the whole page.
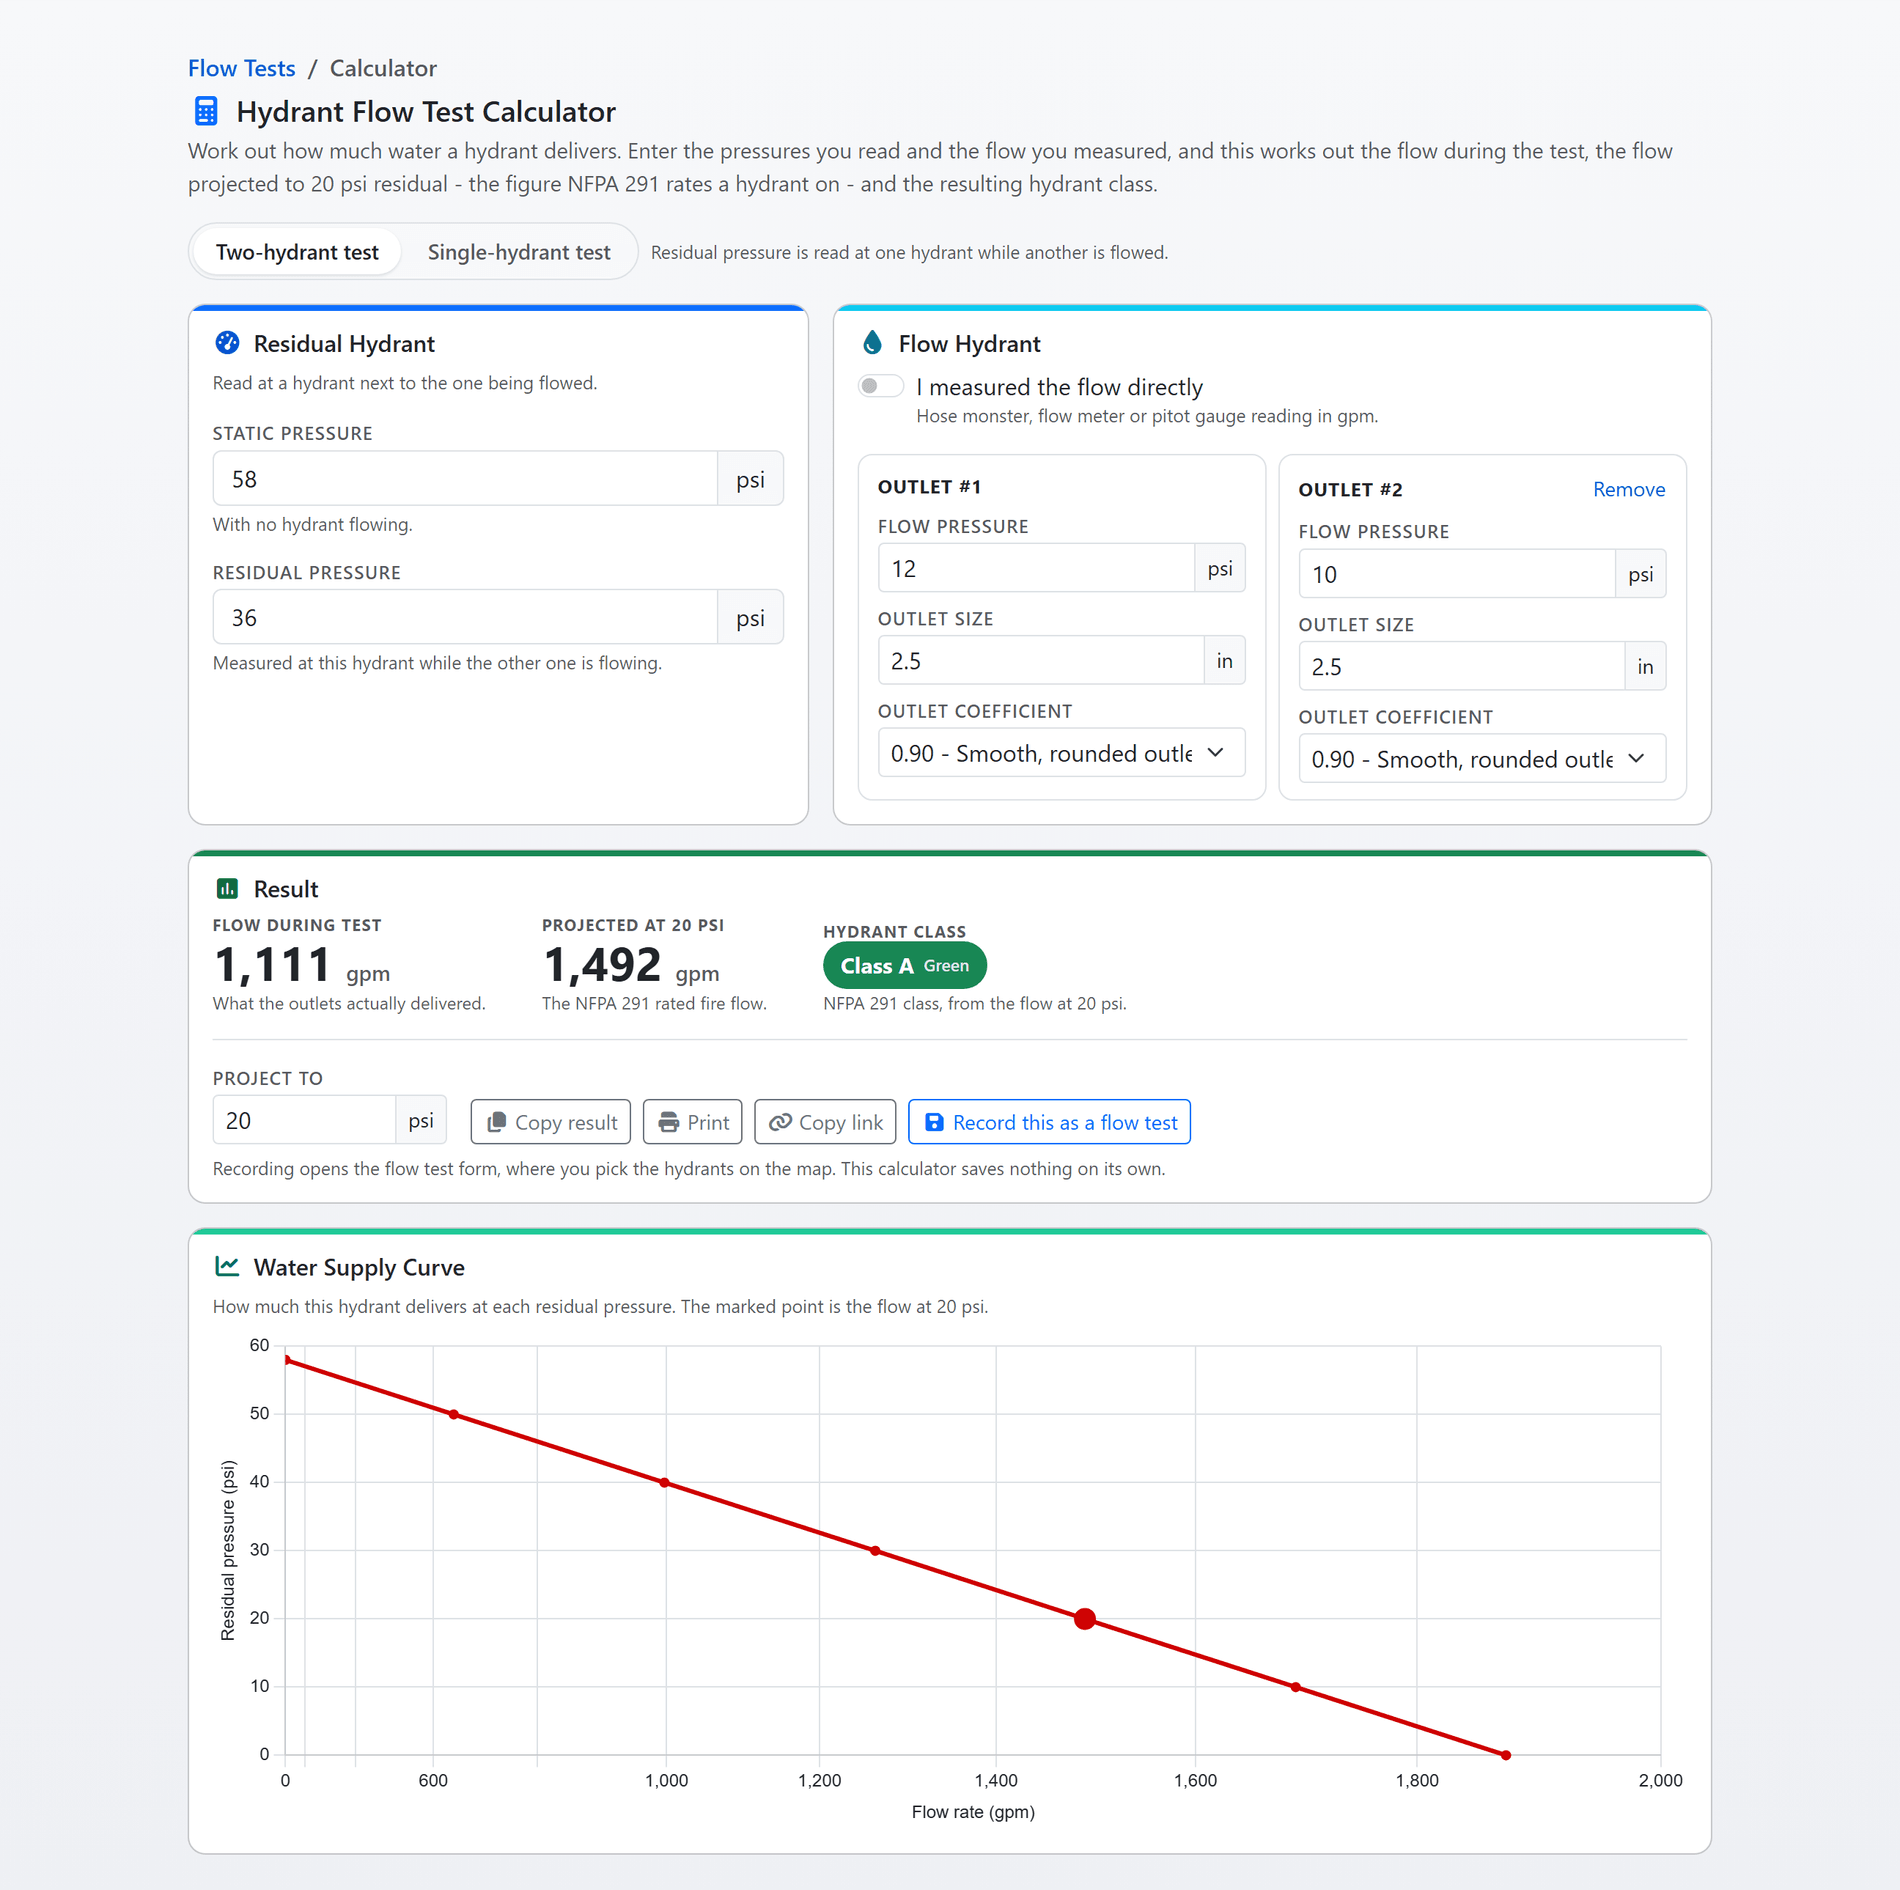
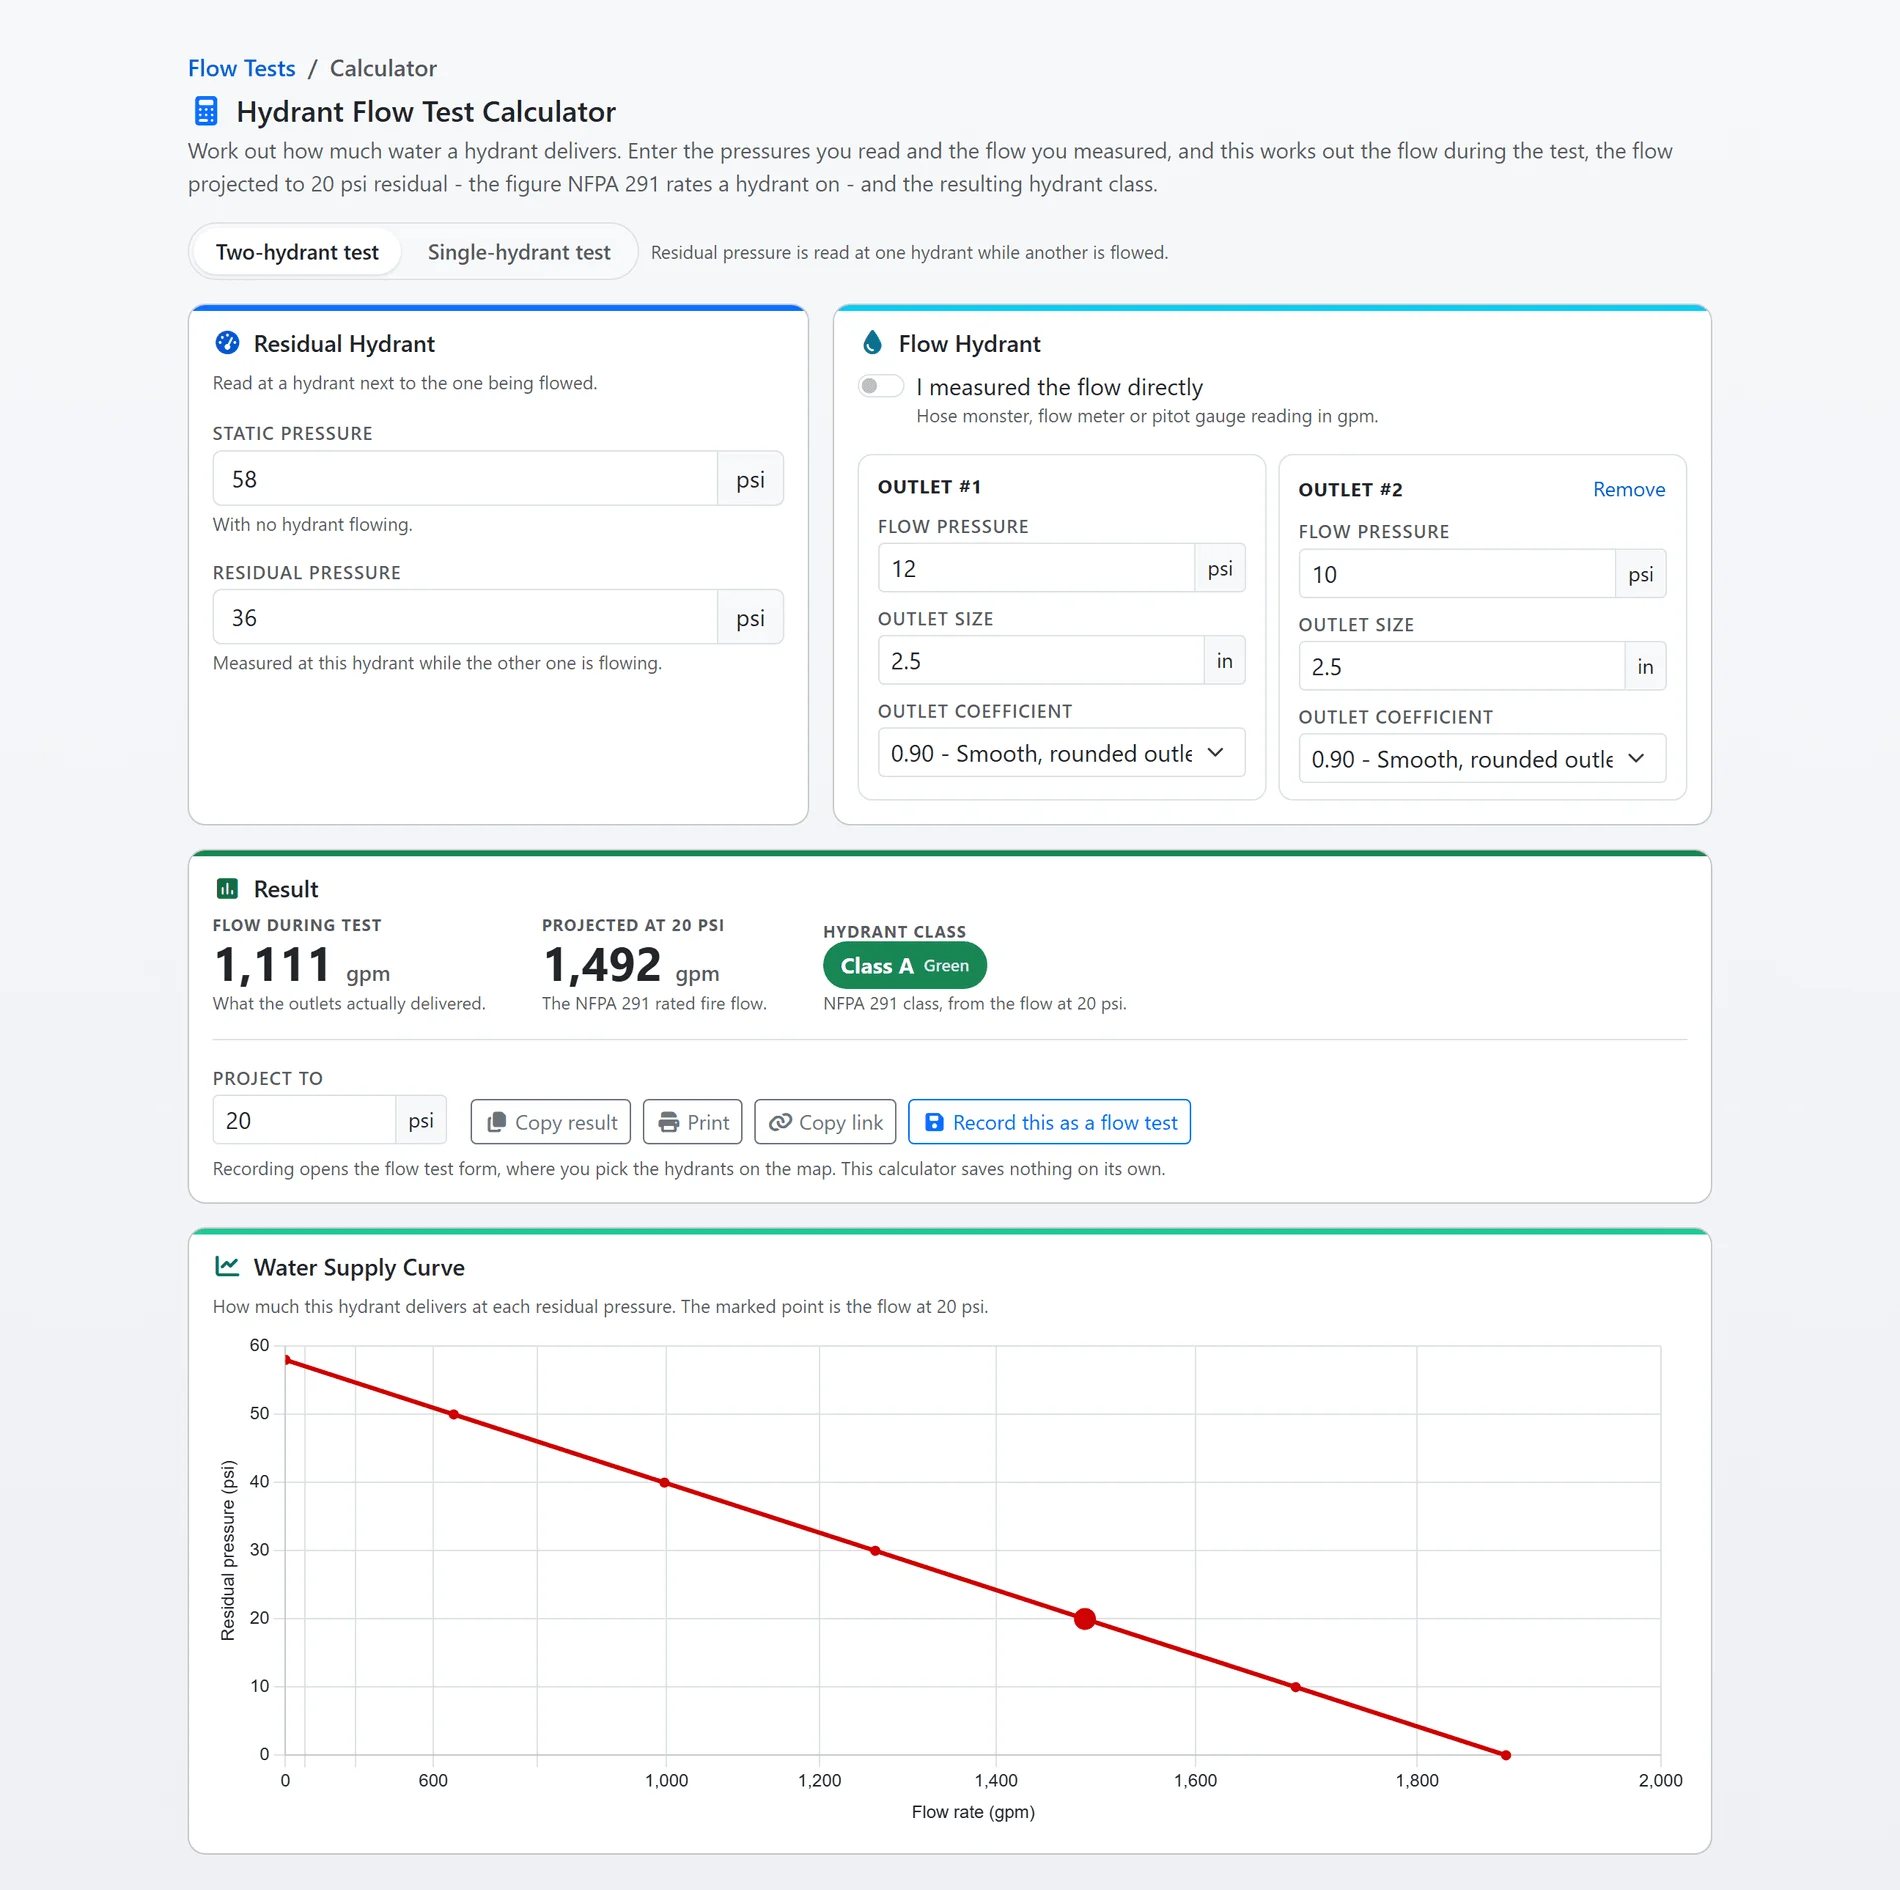
The hydraulics are done for you.
Enter the pressures you read and the outlets you flowed, and the flow during the test, the flow projected to 20 psi residual and the NFPA 291 class appear as you type. The same arithmetic runs on the server when a test is saved, so a browser fault can never write a wrong rating into the record.
- The standard's own formulas: discharge from each pitot reading at 29.83 times the outlet coefficient times the diameter squared times the square root of the pressure, summed across the outlets, then projected to 20 psi with the 0.54 exponent of NFPA 291. Coefficients are picked from the standard's table, not remembered.
- Two-hydrant or single-hydrant tests: residual read at one hydrant while another is flowed, or both read at the same hydrant, and a measured flow from a hose monster or flow meter in place of the pitot readings.
- Rated in NFPA 291 classes: Class AA, A, B or C from the 20 psi figure, in the bonnet colours the standard prescribes, so the badge on screen and the paint on the hydrant agree.
- The curve on the right paper: the water supply curve is drawn on the N to the 1.85 flow axis of NFPA 291, which makes a test a straight line a reader can extend by eye.
- Trends and marginal supply: each test is compared with the same hydrant's previous one, a fall of 25% or more is flagged, and every hydrant under 1,000 gpm reads as marginal on the list and in the analytics.
Shown with sample data.
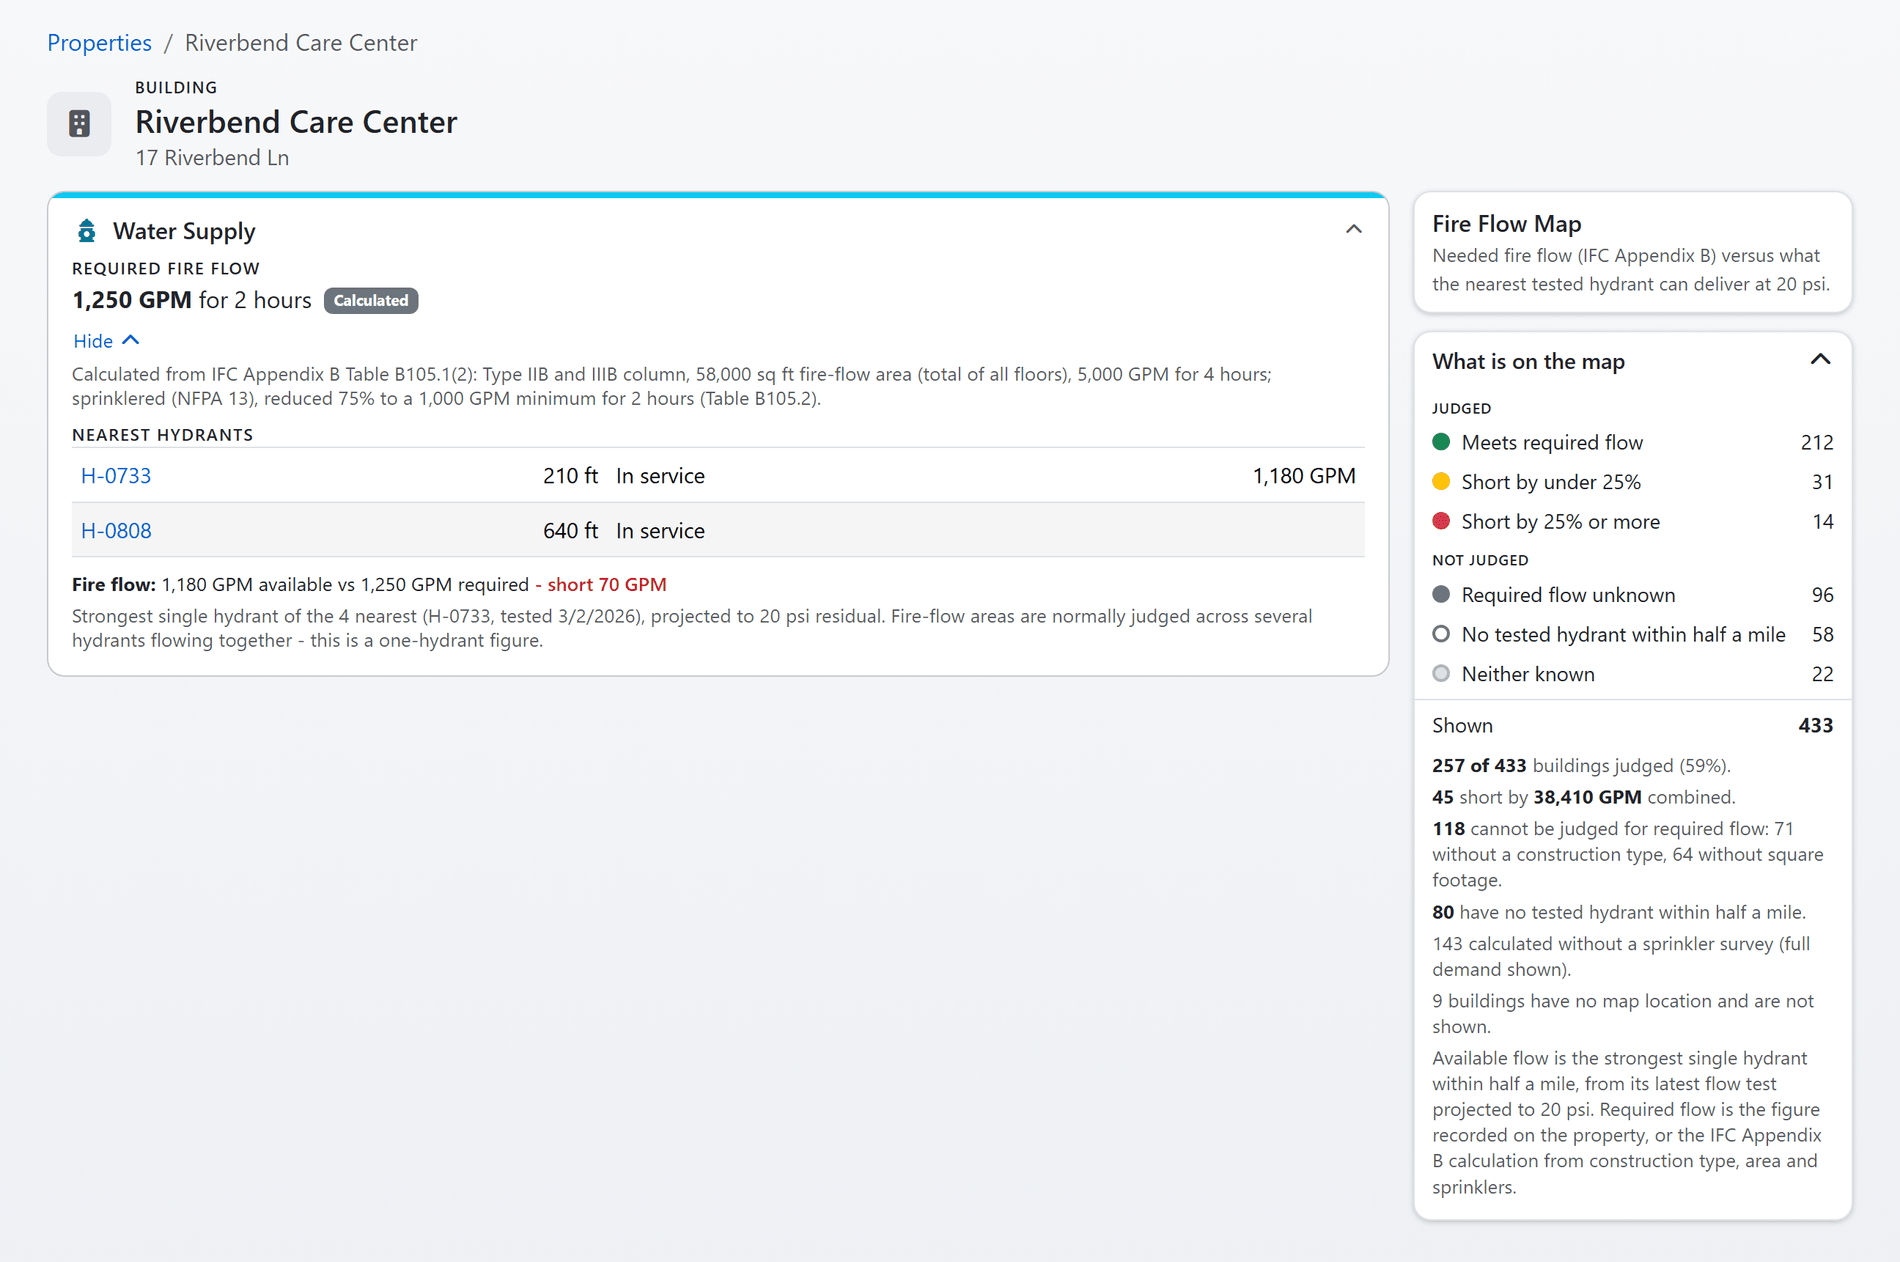
The property record's Water Supply card and the Fire Flow Map's legend, shown with sample data. Click the image to see them up close.
Needed versus available, for every building.
Every building's record carries the fire flow it needs beside what the hydrants around it can deliver. The needed figure is the one your fire marshal recorded, or else the IFC Appendix B calculation from construction type, floor area and the sprinkler finding, with its working shown. The available figure is the strongest tested hydrant within half a mile, from its latest flow test at 20 psi.
- IFC Appendix B, worked in the open: Table B105.1(2) by construction column and total floor area, Table B105.1(1) for one- and two-family dwellings, the Table B105.2 sprinkler reduction on a positive sprinkler finding, and the note under the number says which table, which column and which credit. A jurisdiction's own amendment to the reduction is honoured.
- Nothing guessed: a missing construction type or area is named instead of filled in, an unsurveyed sprinkler system keeps the full demand, and a hydrant that was never tested shows no flow rather than a zero.
- The shortfall, flagged: where both sides are known the card compares them and says how many gallons a minute short, and it says the figure is a single hydrant's, because single-hydrant ratings do not add across a main.
- The whole district on one map: the Fire Flow Map draws every building in six buckets, meets, short by under 25%, short by 25% or more, and three different unknowns kept apart, with a CSV a chief can hand the water utility.
- The same answer everywhere: the record page, the map, the risk score's water supply category and the preplan all read one calculation, so no two pages describe one building's water differently.
Shown with sample data.
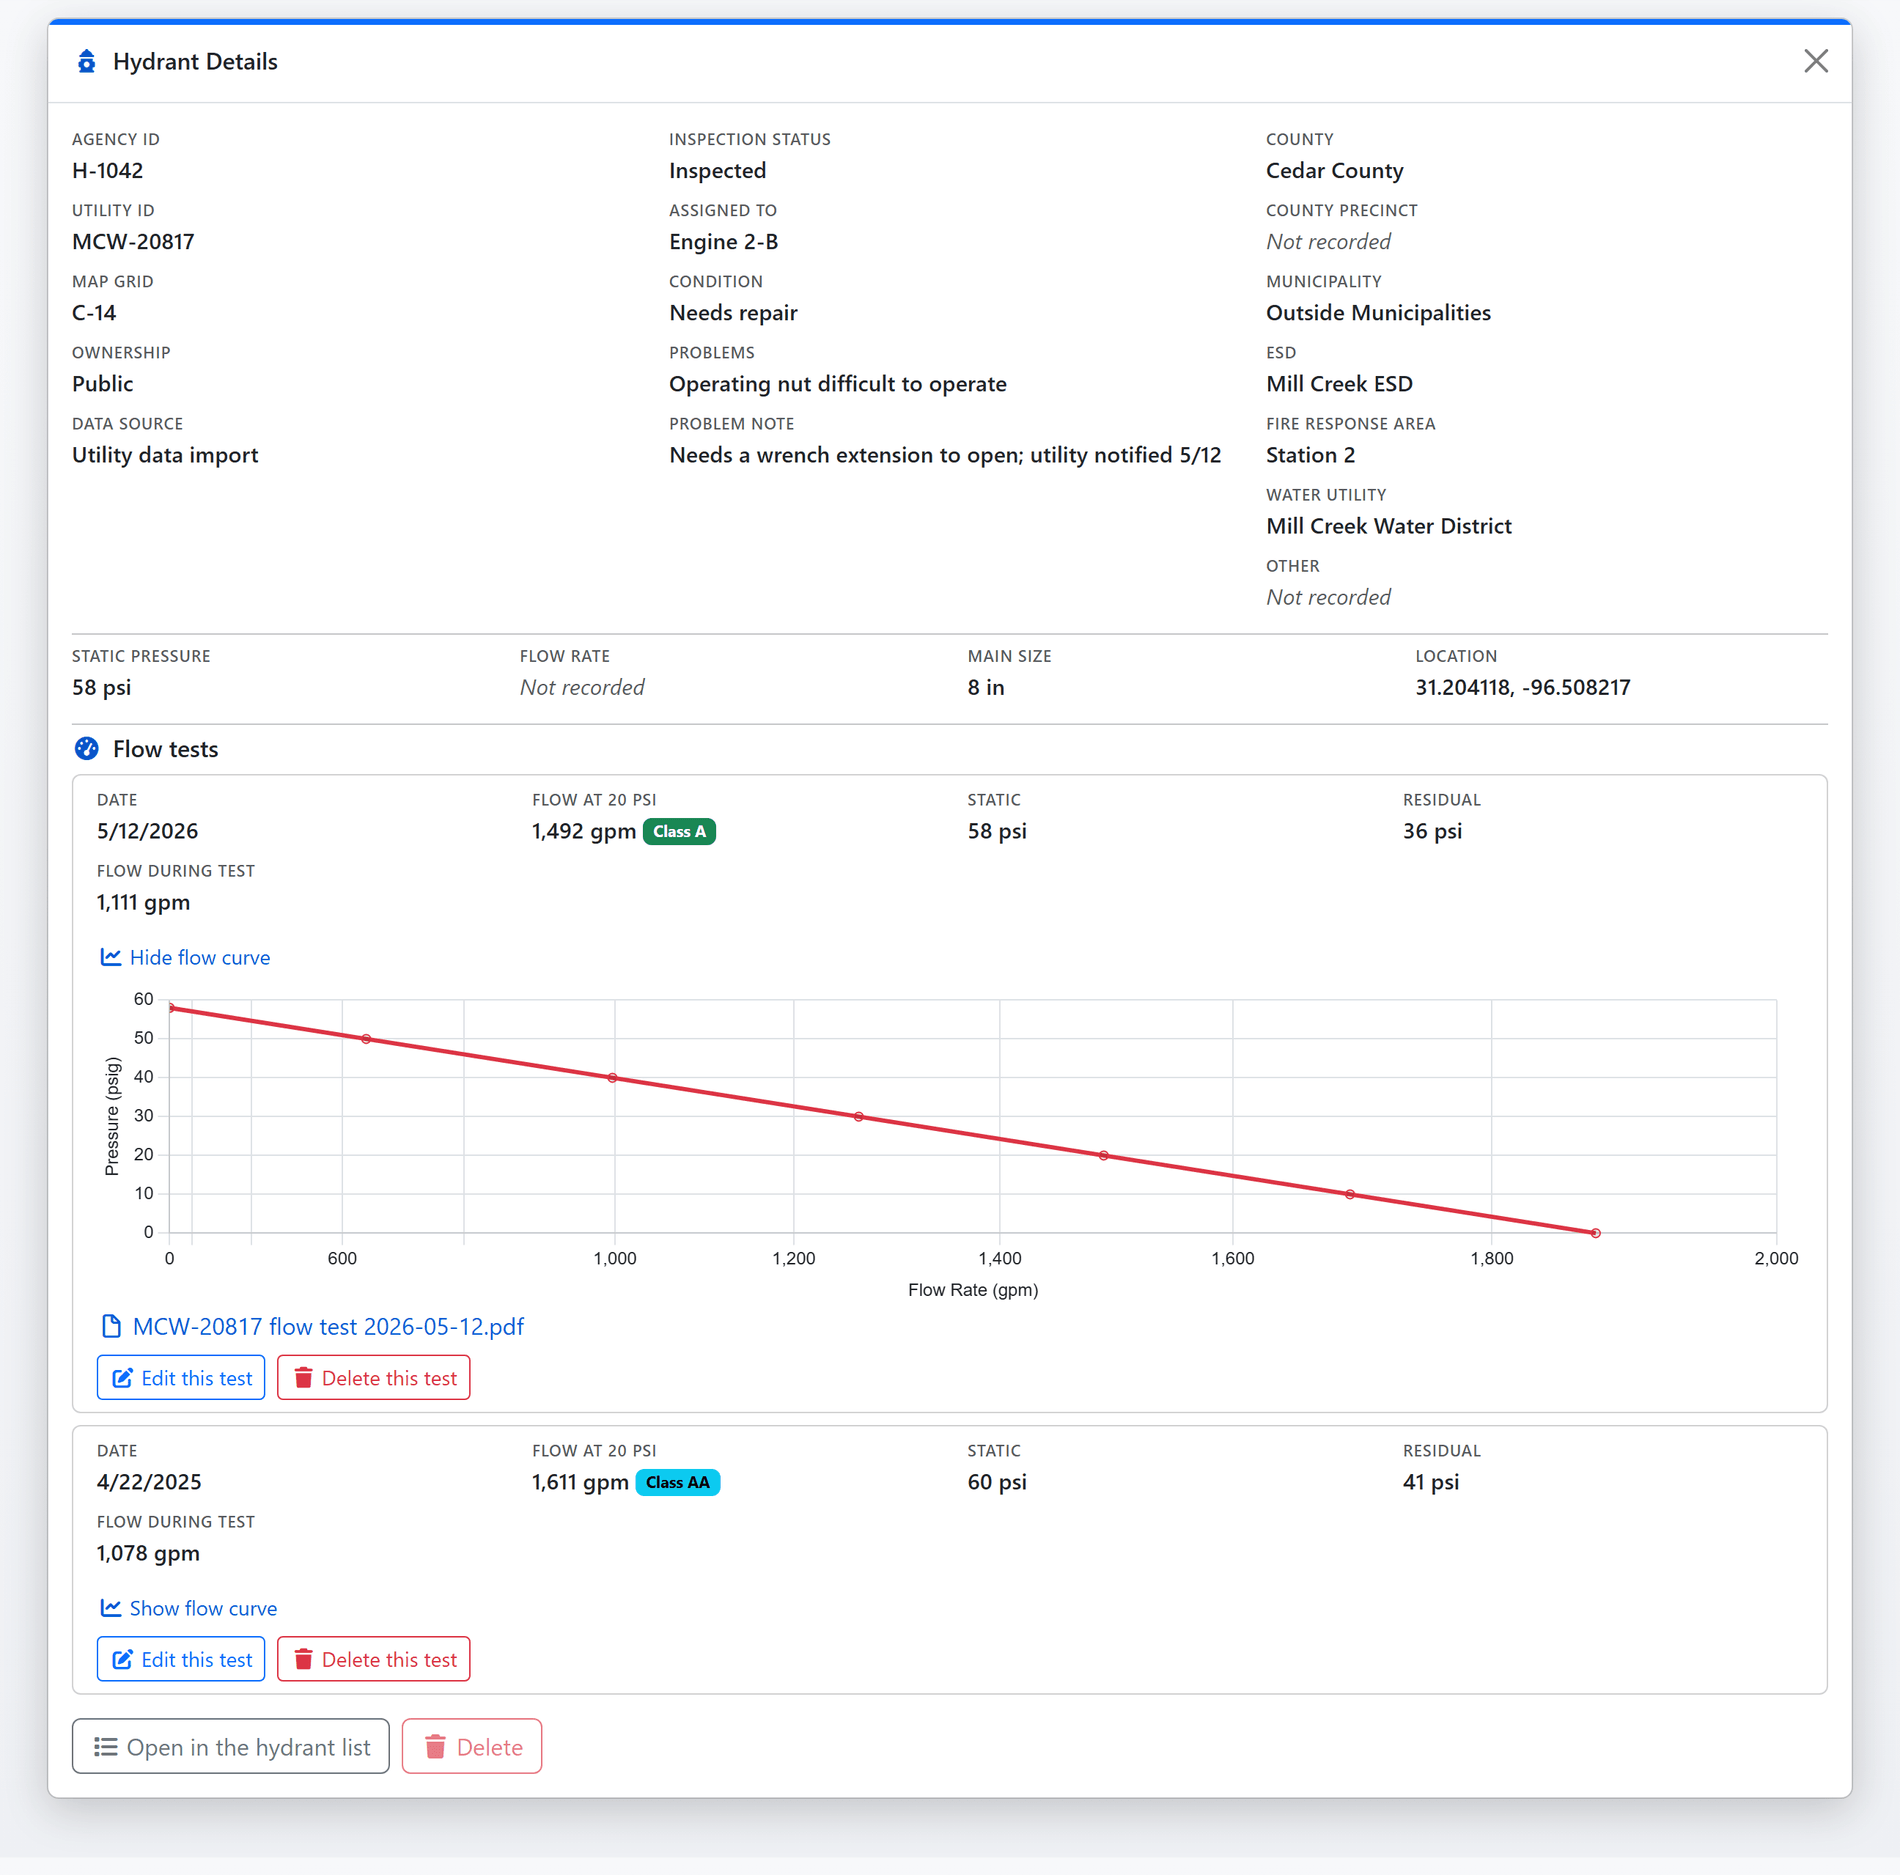
A hydrant's record as the map opens it, shown with sample data. Click the image to see the whole record.
One record per hydrant, from the map or the phone.
A hydrant is one record with two histories: every inspection ever recorded on it and every flow test. Most arrive in a water utility's own data file; the rest are placed on the map by staff. Either way the county, municipality, district, response area and water utility are looked up from where the pin sits, and the record follows the hydrant onto the crew's phone.
- Inspections recorded where the hydrant is: condition, the problems found from a fixed list, a note and an optional static pressure, from the hydrant map on the website or the FireInspection360 mobile app in the field, each visit stamped with the date, the inspector, the unit and the shift.
- Assignments that mean something: a hydrant moves from Unassigned to Assigned to Inspected, and an assignment says who will visit, never whether they have. The cycle is measured from the visit.
- Four ways to colour the map: inspection status, condition, flow test class and inspection cycle, each legend row also a filter with its count, and a view you can share with a colleague at the same place with the same filters.
- The phone carries the same map: inspections, conditions and flow tests as three layers, a hydrant's history under a tap, a new flow test recorded at the hydrant, and the other crews' positions live on the map while you work.
- Evidence is never lost: a hydrant with a flow test cannot be deleted, a hydrant from a utility import cannot be deleted, and a deleted flow test goes to a queue it can be restored from.
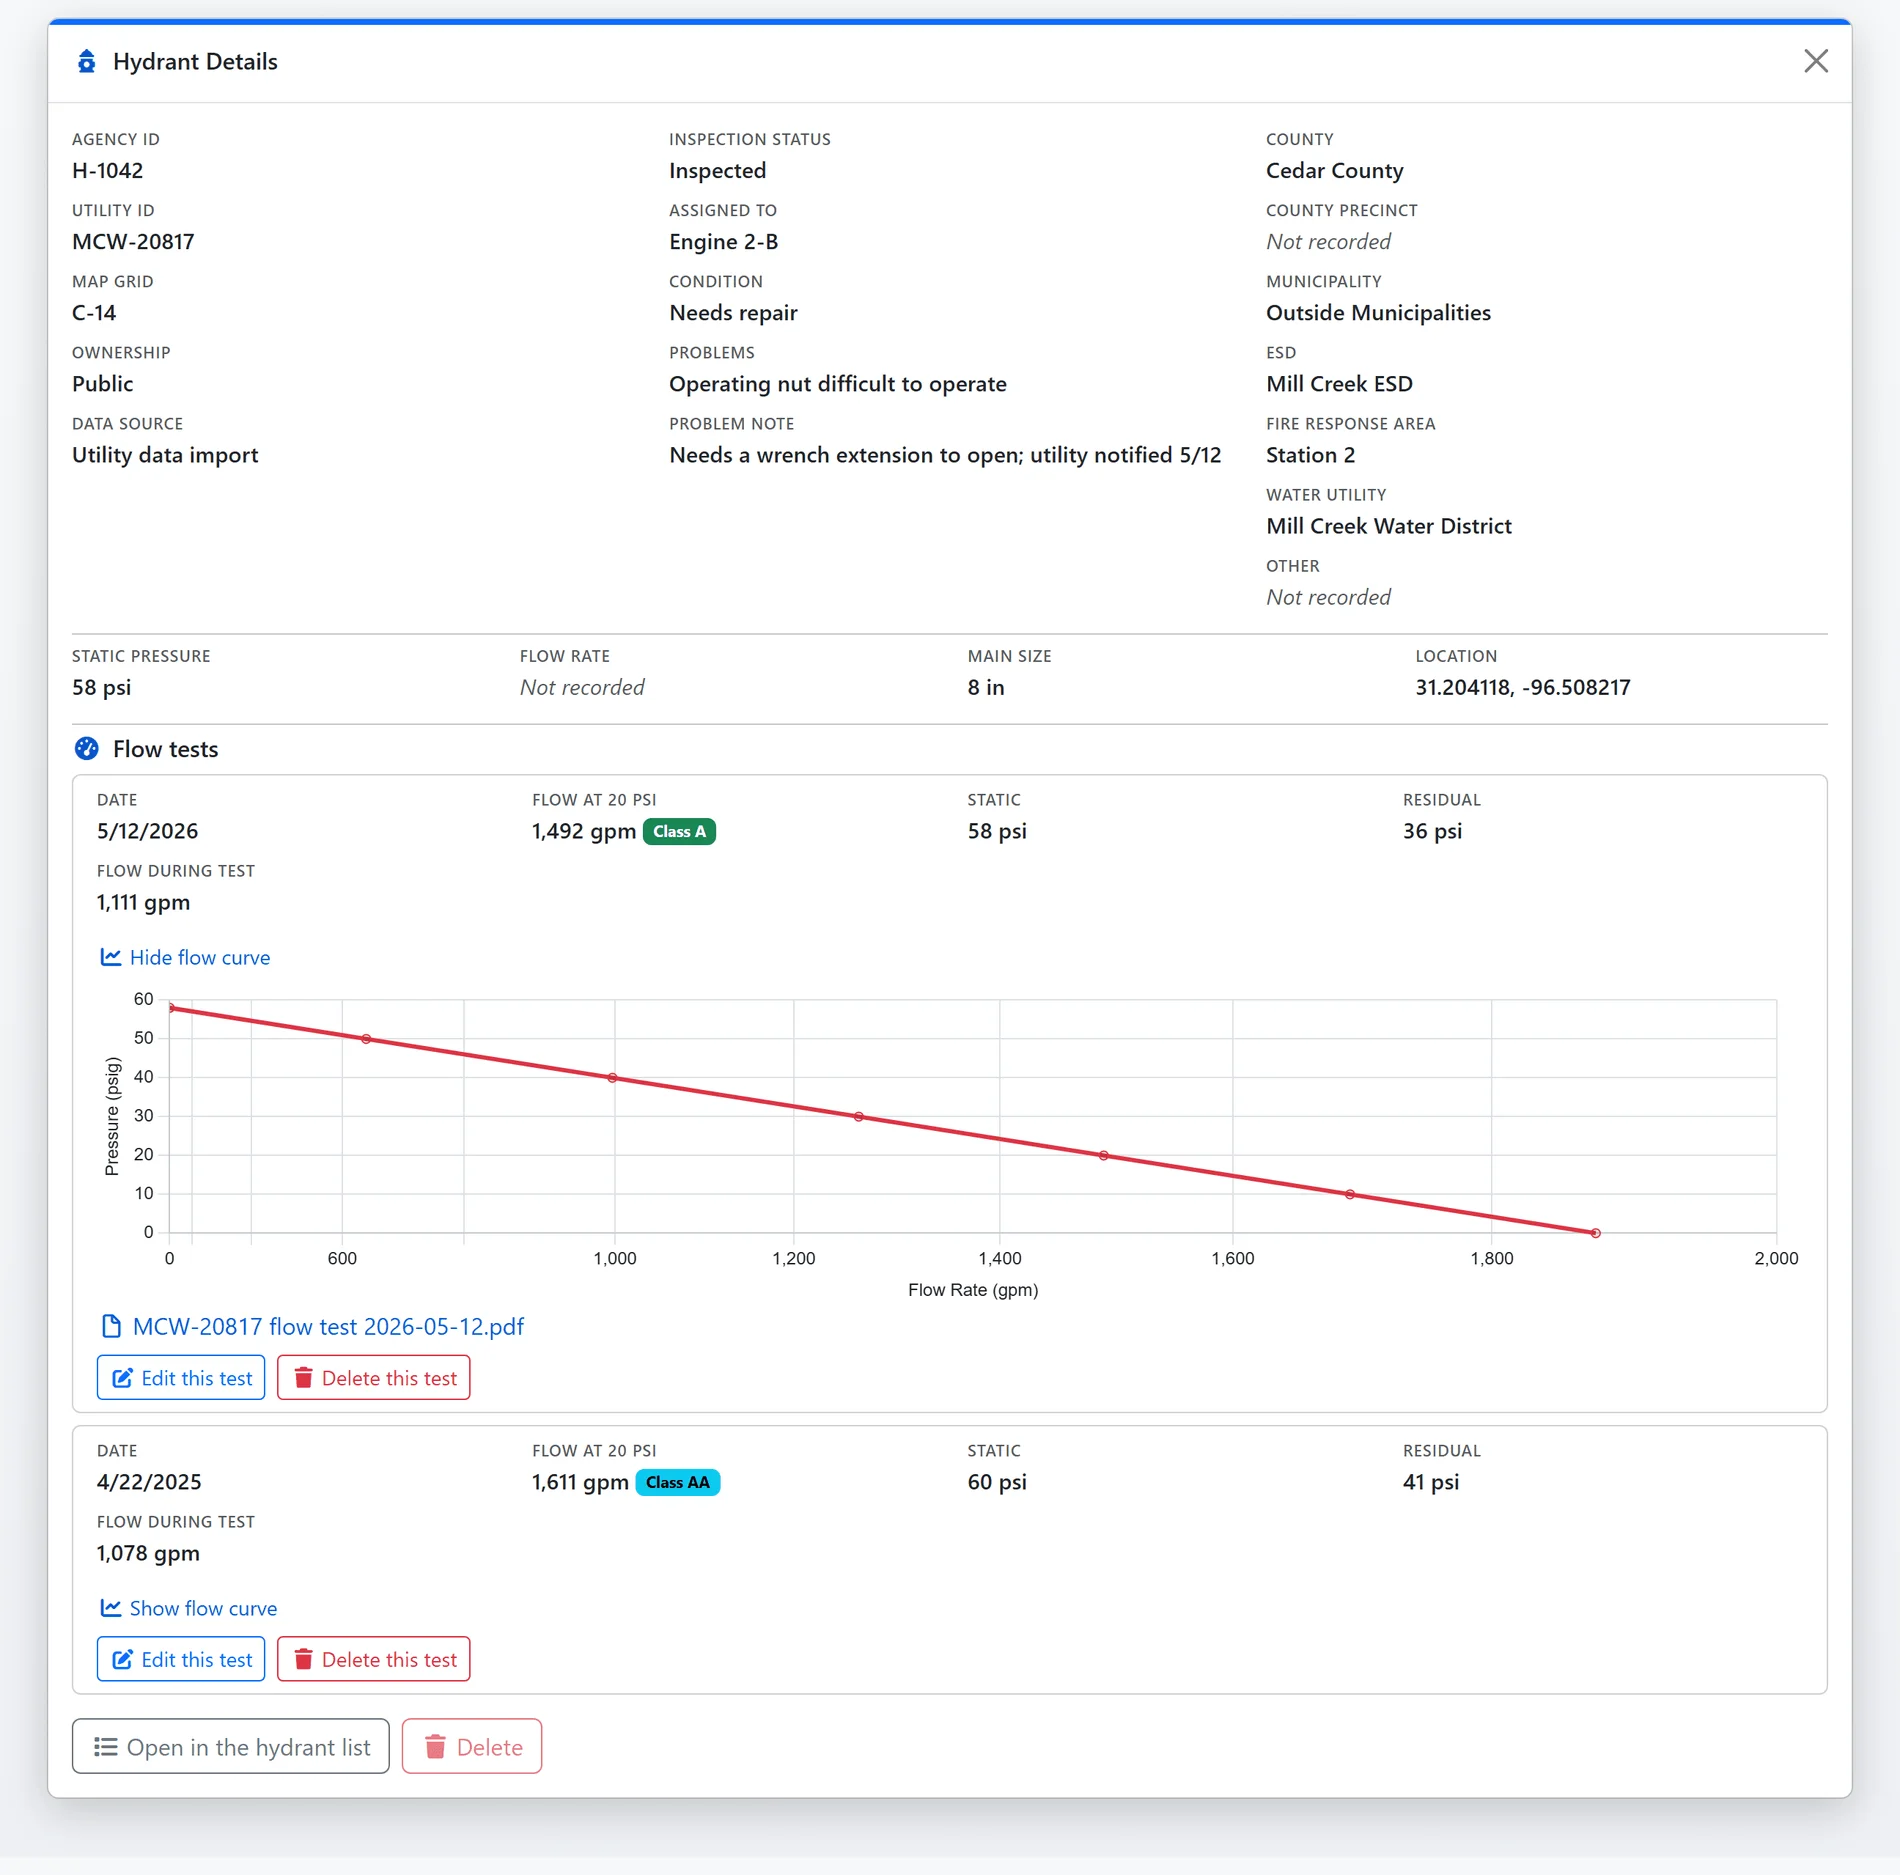
Shown with sample data.
And that is only the start
Hydrant analytics
Coverage against the cycle for the period and the one before it, the repair backlog by condition and by problem, the pace of inspections and how long the outstanding hydrants would take to clear at that pace, and how many tested hydrants are marginal.
Utility data imports
FireInspection360 loads the water utility's own hydrant file for you. Imported hydrants are marked as the utility's, keep their utility ids beside your agency ids, and are inspected and flow tested like any other.
Needs-repair emails
Where a department switches it on, an inspection that records Needs repair or Out of service sends an email at once with the hydrant's ids, its water utility, its coordinates and what was found.
A free public calculator
The flow test calculator is open to anyone without an account at fireinspection360.com/hydrants/flowtests/calculator: the same arithmetic, projected to any pressure you ask for, with a result you can copy, print or send as a link.
Hydrants on the preplan
Every pre-incident plan plots the hydrants within half a mile of its map centre, so a crew reading the plan sees the water with the building.
Water in the risk score
Where your department scores occupancy risk, water supply is one of the categories, worked out from exactly the comparison the property record shows, so the score and the card cannot disagree about one building.
See it with your own hydrants and flow tests.
A one-hour walkthrough with a fire prevention expert, or the demo site right now.